
Authors: Álvaro Rodríguez, Santiago Sainz.
Executive Summary
The Red Sea crisis, triggered by Houthi attacks on commercial vessels since late 2023, has transformed one of the world’s most critical maritime corridors into a persistent geopolitical flashpoint. Despite a sharp reduction in attacks following ceasefire arrangements in 2025, traffic through the Red Sea and Suez Canal remains structurally below pre-crisis levels—Red Sea and Bab el‑Mandeb transits in 2025 fell to around 35–40% of 2023 volumes, and Suez Canal traffic in early 2026 remains roughly 60% lower than before the diversions began. This indicates not a temporary disruption, but a durable reconfiguration of global route choices driven by risk perception, insurance markets, and contract structures, rather than by formal cessation of hostilities alone.
The diversion of traffic around the Cape of Good Hope has added 6,000–11,000 nautical miles and 10–14 days to many Asia–Europe voyages, raising operating costs by up to around US$1 million per trip in fuel alone and contributing to elevated freight rates. While some container and tanker operators have cautiously resumed Suez transits following tentative de‑escalation, a significant share of global traffic continues to avoid the Red Sea, suggesting the emergence of a “dual‑route equilibrium” in which resilience is prioritised over efficiency.
In parallel, climate-driven ice loss is progressively opening the Arctic Sea Route (ASR/NSR), offering up to 30–40% distance reductions on some Europe–Northeast Asia trades. Projections indicate that Arctic routes could handle a non‑trivial share of global traffic by mid‑century and become one of the world’s most carbon‑intensive corridors, particularly for oil, gas and chemical tankers. However, seasonal constraints, high costs, sanctions, and governance gaps limit near-term mainstream adoption. Antarctic and Southern Ocean routes remain largely non‑viable for commercial transit at present, yet climate change, resource pressures, and evolving great‑power competition in the Antarctic Treaty area and Southern Ocean suggest that this maritime frontier will acquire growing geopolitical relevance over the coming decades.
Taken together, these dynamics signal a fragmentation of the global maritime system. Traditional assumptions of open, neutral sea lanes are being eroded by the rise of contested chokepoints, differentiated security architectures, and regionally controlled corridors. The Red Sea crisis illustrates how non‑state actors, embedded in broader regional rivalries and proxy conflicts, can exert outsized influence over global trade flows, with cascading impacts on food security, energy markets, and development trajectories far from the conflict zone.
From a sustainable development perspective, the current re‑routing pattern creates a paradox: risk‑averse route choices aimed at ensuring continuity of trade increase aggregate emissions and environmental pressure, while the gradual opening of polar routes promises shorter distances but shifts carbon and ecological burdens into some of the planet’s most fragile ecosystems. This report argues that maritime geopolitics is now a central dimension of the global sustainability agenda, and that governance responses must simultaneously address security, climate, and development considerations.
Table of Contents
Executive Summary
1. The Red Sea Crisis as Maritime Geopolitical Flashpoint
1.1 The Red Sea and Suez in Global Trade Architecture
1.2 Chronology of the Crisis: From 2023 Escalation to 2025 De‑Escalation
1.3 The Houthi Movement: Non‑State Actor, Proxy and Autonomous Player
1.4 Regional Drivers: Iran–Israel Confrontation, Yemen War, Gaza Conflict
1.5 Quantifying the Disruption: Traffic, Costs and Freight Rate Dynamics
2. Restructuring Global Shipping Networks
2.1 The Cape of Good Hope Detour: From Emergency Response to New Baseline
2.2 Dual‑Route Equilibria: Risk, Insurance and Carrier Strategies
2.3 Port and Corridor Winners and Losers in Africa, Europe and Asia
2.4 Implications for Supply Chain Resilience and Lead Times
3. Emerging Polar and Southern Maritime Frontiers
3.1 The Arctic Sea Route: Climate Openings, Constraints and Commercial Prospects
3.2 Geopolitics in the Arctic: Russia, China and Western Responses
3.3 The Southern Ocean and Antarctica: Governance, Resources and Maritime Access
3.4 From Red Sea to Polar Seas: Interconnected Theatres of Maritime Competition
4. Maritime Geopolitics and the International Order
4.1 From Open Seas to Contested Corridors: Bab el‑Mandeb, Hormuz, Malacca, Panama
4.2 Naval Presence, Security Architectures and the Risk of Incident Escalation
4.3 Fragmentation of Global Maritime Governance: IMO, UNCLOS and Regional Regimes
4.4 Implications for Developing Countries and Small Island Developing States
5. Sustainability, Climate and Environmental Justice
5.1 Emissions Impacts of Rerouting: Cape, Suez and Emerging Polar Corridors
5.2 Environmental Risks in Polar and Southern Oceans
5.3 Maritime Disruptions, Food Security and Inequality
5.4 Integrating Maritime Geopolitics into the Sustainable Development Agenda
6. Scenarios for 2030–2050
6.1 Scenario A: Managed Stabilisation and Partial Recentralisation via Suez
6.2 Scenario B: Enduring Fragmentation and Regionalised Maritime Blocs
6.3 Scenario C: Polar Corridors and a Three‑Route Global System
6.4 Stress‑Testing Global Supply Chains Under Each Scenario
7. Policy and Governance Recommendations
7.1 Building a Red Sea and Western Indian Ocean Security Architecture
7.2 Strengthening Global and Regional Maritime Governance
7.3 Aligning Shipping Decarbonisation with Route and Security Choices
7.4 Supporting Vulnerable Coastal and Port States
8. References
1: The Red Sea Crisis as Maritime Geopolitical Flashpoint
Preliminary Situation Description for Section
Yemen’s Geographic and Strategic Position
Geographical Foundations
The Republic of Yemen occupies a critical position at the southern terminus of the Arabian Peninsula, controlling one of the world’s most vital maritime chokepoints. Bordered by Saudi Arabia to the north and Oman to the east, Yemen’s western and southern coastlines extend along the Red Sea, Gulf of Aden, and Arabian Sea, creating a 1,900-kilometer maritime frontier of extraordinary geopolitical consequence.
The nation’s strategic value derives fundamentally from its territorial dominion over the Bab el-Mandeb Strait—a narrowly constrained waterway separating the Arabian Peninsula from the Horn of Africa (Djibouti and Eritrea) by only 26–32 kilometers at its widest point, and a mere 3–22 kilometers across its two navigable channels. This strait represents the sole direct maritime access connecting the Red Sea to the Indian Ocean via the Gulf of Aden, functioning as the southern gateway to the Suez Canal and, by extension, to the Mediterranean Sea and European ports.
Yemen’s geographic advantage is further magnified by its extensive archipelago of approximately 186 islands distributed across the Red Sea, Gulf of Aden, and Arabian Sea. The most strategically significant of these are Perim Island (Arabic: Mayun), positioned at the precise entrance of the Red Sea within the Bab el-Mandeb Strait at coordinates approximately 12°35′N 43°20′E; and the Hanish Islands, Zuqar, Kamaran, and Socotra, which collectively extend Yemen’s territorial reach and surveillance capabilities deep into maritime chokepoint zones.
Maritime Trade Significance
The Bab el-Mandeb Strait’s economic weight cannot be overstated. Approximately 10–12% of global maritime trade—measured in both cargo tonnage and value—transits this narrow passage annually, making closure or significant disruption economically catastrophic at the global level. This traffic includes:
- Petroleum exports: Between 8.7 and 9.2 million barrels per day of crude oil and refined products originating in the Persian Gulf, destined for European, American, and Asian markets. In 2023, this represented approximately 9% of global oil demand.
- Liquefied Natural Gas (LNG): Substantial volumes of LNG from Middle Eastern suppliers, accounting for a significant fraction of global LNG trade.
- Manufactured goods: Electronics, vehicles, textiles, and industrial components transiting between Asian producers and European/American consumers.
- Agricultural products: Wheat, rice, sugar, and other commodities traded between Southeast Asia, the Middle East, and Africa.
The economic consequence of any disruption is severe: a hypothetical complete closure of the Bab el-Mandeb Strait would force a reroute equivalent to the entire Cape of Good Hope diversion (adding 3,000–4,000 additional nautical miles per journey), multiplying transit times and shipping costs for all affected cargo. The precedent of the 2021 Suez Canal blockage—a six-day grounding of the Ever Given—resulted in global losses estimated at $9 billion per day, demonstrating the acute vulnerability of Middle Eastern trade corridors.
Historical Development and Internal Dynamics (1990–2014)
Post-Cold War State Formation
Following the unification of North and South Yemen in 1990, the Yemeni state emerged as a fragile polity beset by centrifugal pressures. Governance authority remained concentrated in the capital, Sanaa, in the northwestern highlands, while peripheral regions—particularly the tribal-governed southeastern governorates and the cosmopolitan southern port city of Aden—maintained semi-autonomous power structures. The state’s revenue capacity remained fundamentally dependent on oil exports and port rents, both of which experienced volatility during the 1990s and 2000s.
Internally, Yemen’s political identity was structured along overlapping fault lines: the Sunni-Shia sectarian divide (with a substantial Shiite Zaidi population concentrated in the northwest and significant Sunni populations, primarily Shafi’i and Salafi, in central and southern regions); tribal-territorial divisions (with powerful tribal confederations maintaining autonomous military and political authority); and urban-rural economic disparities (with Sanaa and Aden serving as cosmopolitan centers while rural highland and desert regions remained economically marginalized).
The Houthi Movement: Origins and Rise (2004–2014)
The Houthi movement emerged in the early 2000s as a regional insurgency originating in the northwestern Saada Governorate, home to Yemen’s significant Zaidi Shia population. Founded by Hussein Badreddin al-Houthi (killed in 2004) and subsequently led by his brother Abdulmalik al-Houthi, the movement began as a localized rebellion against the Yemeni government’s perceived marginalization of Zaidi Shia interests and alleged collaboration with Sunni Salafi movements and Western powers.
Between 2004 and 2010, the Yemeni government conducted six rounds of military operations against the Houthis in what became known as the “Saada Wars,” causing widespread civilian displacement and strengthening Houthi societal legitimacy as defenders of Shia grievances. Critically, during this period, reports emerged suggesting Iranian support for Houthi forces—though direct Iranian military involvement remained limited and the extent of Iranian financial and logistical support remains contested among scholars.
The Houthis’ political narrative shifted significantly from purely sectarian grievances toward broader populist and anti-Western positioning, particularly following the 2003 invasion of Iraq (perceived as American imperialism targeting the Muslim world) and the U.S. drone campaign initiated in Yemen in 2002. This reframing allowed the movement to extend its appeal beyond Shia constituencies to include nationalist and anti-interventionist Sunni elements, particularly among educated youth and civil society affected by Yemen’s economic stagnation.
State Collapse and Civil War (2014–Present)
The 2015 Houthi Seizure of Power
In September 2014, following weeks of street protests against President Abdrabbuh Mansur Hadi’s administration—which had implemented unpopular austerity measures including cuts to fuel subsidies—Houthi forces conducted a military offensive northward from their Saada stronghold. On September 21, 2014, Houthis captured Sanaa, the capital, in a swift operation that exposed the fragility of state institutions and the Hadi government’s military weakness.
The Houthi takeover proceeded in stages. By early 2015, Houthi forces:
- Dissolved the Yemeni parliament and established a Supreme Revolutionary Committee to govern the country.
- Forced President Hadi to flee to Saudi Arabia.
- Consolidated control over the northwestern and central regions, including Yemen’s most populous areas.
- Formed a strategic alliance with forces loyal to Ali Abdullah Saleh, Yemen’s former president (1978–2012), who had been marginalized under Hadi’s administration.
This coalition of Houthis + Saleh loyalists effectively controlled Yemen’s state apparatus, including government ministries, the central bank, and significant segments of the military establishment.
The Saudi-Led Intervention and Proxy Conflict Dynamics
Responding to Hadi’s request for external military support, on March 25–26, 2015, a coalition of Arab states led by Saudi Arabia launched “Operation Decisive Storm,” initiating a sustained military campaign of air strikes, naval blockade, and ground operations intended to restore the Hadi government and roll back Houthi control.
The coalition, formally endorsed by the Gulf Cooperation Council (with the notable exception of Oman, which sought a neutral mediation role), included:
- Saudi Arabia (military command and financing)
- United Arab Emirates (ground troops and tactical coordination)
- Egypt, Morocco, Jordan, Bahrain, Sudan, and Kuwait (supporting air and naval operations)
- The United States (provision of intelligence, refueling support, and limited military coordination)
However, the conflict quickly transformed into a proxy struggle between Saudi Arabia and Iran for regional hegemony. While official Iranian military intervention remained limited, Iran provided financial support, training, and advanced weaponry (including drones, anti-ship missiles, and ballistic missiles) to Houthi forces. The Houthis, in turn, adopted increasingly sophisticated military capabilities and began framing their resistance not merely as local self-determination but as part of a broader Islamic Resistance Axis opposing U.S. hegemony and Israeli actions in the region—rhetoric particularly amplified following the October 2023 Hamas-Israel conflict.
Humanitarian Collapse and Stalemate (2015–2024)
Despite initial Saudi-led coalition successes in retaking southern Yemen (including the strategic port city of Aden in July 2015), military operations failed to dislodge Houthi forces from the northwest, particularly Sanaa and surrounding governorates. Prolonged air strikes killed thousands of civilians and devastated civilian infrastructure—hospitals, schools, power plants, and water systems—without significantly weakening Houthi military capacity or resolve.
By 2016, Yemen had descended into one of the world’s worst humanitarian crises:
- Approximately 80% of Yemen’s population (24+ million people) became displaced, food-insecure, or dependent on humanitarian assistance.
- Cholera and other waterborne diseases proliferated due to collapse of sanitation infrastructure and contaminated water supplies; by 2020, Yemen had experienced multiple cholera outbreaks affecting hundreds of thousands.
- Malnutrition rates among children exceeded 45% in some governorates.
- An estimated 380,000 excess deaths occurred between 2015 and 2021 attributable to the conflict, starvation, and disease, according to the Comprehensive Peace Agreement Credibility Initiative.
Following UN-mediated negotiations initiated in December 2015, a series of temporary ceasefires were implemented (notably 2018–2019 and 2022–2023), reducing active combat intensity but failing to achieve political settlement. The conflict has devolved into a grinding stalemate characterized by:
- Houthi control of the northwestern governorates (Sanaa, Saada, Amran, Dhamar, and surrounding areas), home to approximately 70% of Yemen’s population.
- Saudi-aligned and UAE-backed forces controlling southern and eastern Yemen, fragmented among multiple factions including the internationally recognized government, the Southern Transitional Council (a separatist entity backed by the UAE), and various tribal militias.
- Persistent Houthi military attacks against Saudi infrastructure, regional shipping, and other strategic targets.
Internal Fragmentation and Competing Centers of Power
A crucial aspect of the contemporary Yemeni conflict is its transformation into a multi-sided struggle rather than a binary Houthi-government confrontation. Key actors now include:
1. The Houthis (Ansar Allah): The de facto state authority in northwestern Yemen, with hierarchical military and political structures controlled by the al-Houthi family (particularly Abdulmalik al-Houthi). Their organization includes both conventional military forces and asymmetric capabilities (drone production, missile manufacturing, naval operations).
2. The Internationally Recognized Government (IRG): Formally led by President Hadi, physically based in Saudi Arabia and in Aden, commanding fragmented military forces and lacking domestic legitimacy in many southern and eastern regions.
3. The Southern Transitional Council (STC): An explicitly separatist movement seeking southern Yemen independence, backed militarily and financially by the UAE. The STC has engaged in direct military conflict against both Houthi forces and the IRG, capturing strategic cities including Aden (temporarily in 2019–2024).
4. Tribal and Regional Militias: Dozens of armed groups controlled by local tribal leaders, each pursuing parochial interests and shifting allegiances based on tactical advantage.
This fragmentation means that even a hypothetical Houthi-Saudi agreement would not necessarily produce state reconstruction, as control of southern territory remains contested among multiple incompatible factions.
Yemen’s Strategic Geography and the Bab el-Mandeb: Why Control Matters
The geographic positioning of Yemen within the Bab el-Mandeb Strait creates a unique military-strategic asymmetry. While Yemen itself possesses minimal conventional military capacity (no functioning navy, limited air force, and economically devastated defense infrastructure), its coastal dominance of the strait provides access to globally critical maritime lanes with minimal technical barriers to interdiction.
Narrow Bottleneck Geometry
The Bab el-Mandeb’s narrowness creates fundamental geographic constraints on maritime traffic. The strait is divided by Perim Island (Yemen’s possession) into two channels:
- The eastern channel (between Perim and Yemen’s mainland coast): approximately 3 kilometers wide, with average depth 20–30 meters—unsuitable for large tankers and avoided by most international traffic.
- The western channel (between Perim and Djibouti/Eritrea): approximately 22 kilometers wide, with depth approximately 280 meters—the practical maritime corridor for large vessels.
For large ships, tankers, and especially supertankers carrying oil and LNG, the western channel is effectively the only usable route. This creates a geography of vulnerability: any actor capable of threatening shipping in a 22-kilometer-wide corridor can impose significant costs on global commerce without requiring control of the entire strait or military parity with defending powers.
Houthi Asymmetric Naval Capabilities
Beginning in 2016–2017, Houthi forces developed asymmetric maritime strike capabilities including:
- Unmanned aerial vehicles (drones): Initially surveillance/reconnaissance platforms, progressively weaponized with explosives to attack regional targets and vessels.
- Fast attack craft: Modified speedboats equipped with explosives, used for suicide attacks and harassment operations.
- Anti-ship cruise missiles: Developed indigenous or supplied by Iran, including the Houthi C-802 derivative, capable of threatening large commercial vessels and military ships at ranges exceeding 100 kilometers.
- Naval mines and underwater obstacles: Deployed to restrict navigation corridors.
Critically, these capabilities require no conventional naval fleet, no air force, and no significant power projection capacity—only presence in coastal areas Yemen already controls and technical capability to operate relatively inexpensive weapons systems. This creates the geographic paradox: a militarily weak state, devastated economically, controls a chokepoint that can constrain global commerce.
Yemen in the Broader Regional Security Complex
Yemen’s instability and the Houthi movement’s rise cannot be isolated from the broader regional security architecture of the Middle East. The conflict instantiates several intersecting dynamics:
1. Saudi-Iranian Regional Competition: Yemen has become the primary arena of Saudi-Iranian proxy competition, as both regional powers seek to deny the other’s sphere of influence and assert hegemonic claims over the Arabian Peninsula and surrounding maritime zones.
2. Great Power Strategic Interests: The United States, China, Russia, and European powers maintain strategic interests in Red Sea security, trade route protection, and regional geopolitical positioning, leading to varying degrees of military and diplomatic involvement.
3. Sectarian-Nationalist Ambiguity: While the Houthi movement is characterized as a Shia insurgency with Iranian links, it has increasingly adopted nationalist and anti-Western framing that appeals beyond sectarian constituencies, complicating efforts to categorize the conflict as purely sectarian or as Iranian proxy warfare.
4. State Failure and Humanitarian Spillovers: Yemen’s collapse as a functional state has created ungoverned spaces conducive to transnational extremist organizations (Al-Qaeda in the Arabian Peninsula, ISIS affiliates), human trafficking networks, and regional refugee flows that destabilize neighboring countries including Saudi Arabia, Djibouti, and Oman.
Implications for Maritime Security and Global Trade
The convergence of Yemen’s geographic control of the Bab el-Mandeb Strait, the Houthi movement’s asymmetric capabilities, and the broader regional conflict dynamic creates a novel form of maritime vulnerability wherein a non-state actor with limited conventional military power can nonetheless impose significant constraints on global trade, energy security, and supply chain continuity.
This situation represents a fundamental challenge to the post-Cold War international order’s assumptions about maritime security, wherein great-power navies (notably the U.S. Navy) were presumed capable of guaranteeing freedom of navigation through critical chokepoints. The Houthi attacks on shipping beginning in November 2023—discussed in detail in Section 1.3 of the main report—demonstrate both the potency and the limitations of this geographic vulnerability: while Houthis lack power to permanently close the strait, they possess sufficient capability to impose costs (in risk premiums, rerouting, and delays) that fundamentally alter global shipping economics and supply chain resilience.
1.1 The Red Sea and Suez in Global Trade Architecture
The Red Sea, together with the Suez Canal and the Bab el-Mandeb Strait, represents one of the world’s most strategically critical maritime corridors. Approximately 12–15% of global maritime trade by volume transits this chokepoint annually, with particularly high concentrations in containerized cargo—estimates place Red Sea container shipping at approximately 30% of global container traffic.
This extraordinary centrality reflects the corridor’s fundamental role as the shortest and fastest maritime route linking Europe and Asia, bypassing circumnavigation around Africa. For shipping companies, the choice is stark: traverse the Red Sea and Suez Canal in approximately 14 days (Asia to Europe), or reroute around the Cape of Good Hope over 21–24 days. This speed advantage translates directly into operational cost savings, inventory efficiency, and competitive advantage in time-sensitive markets.
Beyond raw trade volumes, the Red Sea corridor carries commodities essential to global food security, energy markets, and manufacturing supply chains:
- Rice exports: Approximately 20% of global rice exports transit the Red Sea, predominantly from Asia to Africa and the Middle East, underpinning food security for over 1 billion people in sub-Saharan Africa and developing Asia.
- Wheat and grain: Approximately 15% of global wheat exports flow through Bab el-Mandeb, primarily sourced from Eastern Europe and destined for Middle Eastern, African, and Asian markets.
- Crude oil and refined products: The Red Sea carries an estimated 8.6 million barrels per day of Persian Gulf crude oil destined for Europe, with significant flows to Asia via alternative routings.
- Liquefied natural gas (LNG): Qatar and other Gulf producers ship LNG through the corridor to Europe and increasingly to Asia, with critical importance for European energy security given Russian supply constraints post-2022.
- Containerized cargo: High-value electronics, pharmaceuticals, machinery, and manufactured goods worth hundreds of billions of dollars annually flow through Red Sea container services.
For Egypt, the Suez Canal Authority represents an irreplaceable source of foreign currency revenue, generating approximately $6 billion annually before the recent crisis. For a nation with persistent fiscal vulnerabilities, foreign exchange constraints, and development funding pressures, this revenue stream is not peripheral but central to national economic stability. In 2024, Suez Canal revenues declined precipitously as traffic diverted, creating immediate fiscal pressure on the Egyptian government.
The geographical configuration creates a “natural monopoly” in routing. The Bab el-Mandeb Strait narrows to only 30 kilometers at its narrowest point, and the Suez Canal traverses Egyptian sovereign territory, placing the corridor under singular state control. Combined with the technical requirements of canal transit (pilots, passage fees, scheduling), this creates an assumed underlying two centuries of global trade: that the Red Sea–Suez corridor would remain open, neutral, and accessible to all flags and operators under international maritime law.
This assumption proved fragile beginning in November 2023.
1.2 Chronology of the Crisis: From 2023 Escalation to 2025 De-Escalation
Phase 1: Rapid Escalation and Network Collapse (November 2023–February 2024)
The Houthi attacks on commercial shipping in the Red Sea began in mid-October 2023 but escalated dramatically from late November 2023 onwards. The first significant attack occurred on October 19, 2023, against the M/V Galaxy Leader, a vehicle carrier operated by Israeli-linked companies. By early 2024, Houthi attacks had become systematic and frequent, with multiple strikes weekly against container ships, tankers, and general cargo vessels in the Bab el-Mandeb Strait and Red Sea proper, regardless of flag or cargo destination.
The Houthis explicitly stated their operational rationale: solidarity with Palestinian civilians affected by the Israeli military campaign in Gaza (initiated October 7, 2023), and opposition to perceived U.S. and Israeli regional hegemony. By October 2024, the Houthis had conducted over 190 maritime attacks, demonstrating sustained operational capability and evolving attack sophistication, including use of ballistic missiles, anti-ship cruise missiles, suicide drones, and remotely operated naval vessels.
The immediate impact on shipping networks was catastrophic. Daily vessel transits through the Bab el-Mandeb Strait collapsed from an average of approximately 70 merchant ships per day (2023 baseline) to roughly 35 per day by early 2024—a 50% reduction in volume. Container shipping experienced even sharper declines, with 90% collapse in Suez Canal container transits between December 2023 and March 2024. Overall Red Sea traffic declined by 57.5%, from an average daily volume of 4.0 million metric tons in late 2023 to approximately 1.7 million metric tons by early 2024.
Shipping companies, confronted with insurance surcharges, heightened risk premiums, potential vessel damage, and crew safety concerns, made rapid strategic decisions. The alternative routing around the Cape of Good Hope surged by an estimated 74% above prior-year levels in early 2024. This represented not merely temporary diversion but a structural shift, as the alternative route added 6,000–11,000 nautical miles to Asia–Europe voyages and extended transit times by 10–14 days, directly increasing per-ship fuel consumption costs by approximately $1 million per voyage.
Phase 2: Stabilized Disruption and Tentative Recovery (March 2024–September 2025)
From March 2024 onwards, despite U.S. and coalition military interventions against Houthi capabilities (including airstrikes on Houthi command centers, weapons depots, and launch facilities), attacks did not cease but rather entered a pattern of sporadic operations. While attack frequency diminished somewhat compared to the January–February 2024 peak, the threat perception remained sufficiently credible to sustain rerouting behavior among risk-averse shipping operators.
During this extended period, Red Sea traffic remained persistently suppressed at 35–40% of pre-crisis baselines. Insurance risk premiums remained elevated, particularly for Red Sea transits, and major shipping operators—including MSC, CMA CGM, and Maersk—maintained mixed or cautious policies on Red Sea routing. While some carriers conducted trial transits through the Suez Canal, particularly after periods of reduced attack activity, broad-based confidence restoration remained elusive.
The economic costs of prolonged disruption accumulated. Shipping companies operating on thin profit margins (typically 2–5% net margins pre-crisis) absorbed higher fuel costs from longer voyages, sustained insurance surcharges, and operational complexity. For time-sensitive commodities—fresh produce, pharmaceuticals, semiconductors, e-commerce goods—the extended transit times created substantial losses as perishable goods spoiled, contract deadlines were missed, and just-in-time (JIT) manufacturing schedules were disrupted.
Global inflation dynamics were affected. Industry assessments and central bank analyses indicated that container shipping cost increases directly attributable to Red Sea disruption contributed measurably to global inflation in 2024–2025, with particular impact on food prices in vulnerable regions, manufacturing supply costs, and energy markets.
Phase 3: Tentative De-Escalation and Partial Recovery (October 2025–January 2026)
Beginning in October 2025, following the Gaza ceasefire agreement formalized on October 10, 2025, and a Houthi announcement of a pause in maritime attacks, a marked shift occurred in the threat environment. While Houthis did not formally renounce attacks permanently, the operational pause created the first significant window of reduced threat since November 2023.
Suez Canal authorities reported immediate recovery signals. October 2025 saw 229 vessels transit the canal—the highest monthly figure since the crisis began. For the July–October 2025 period, a total of 4,405 ships carrying 185 million metric tons transited the canal, compared to 4,332 vessels with 167.6 million tons during the same period in 2024—representing modest recovery. Egypt’s Suez Canal Authority reported that revenues rose 14.2% year-over-yearbetween July and October 2025, signaling a return of some commercial confidence.
However, as of January 2026, the recovery remains partial and fragile. Red Sea traffic continues at approximately 60% below pre-crisis levels, and Suez Canal transits remain substantially depressed compared to 2023 baselines. Multiple factors explain this persistent suppression despite reduced hostilities:
- Risk Perception vs. Risk Reality Divergence: Shipping companies, having invested in reorganizing logistics networks around the Cape route, exhibit organizational inertia. Reversing these decisions requires sustained confidence that threats are permanently eliminated, not merely temporarily suspended. Given the underlying geopolitical drivers (Gaza conflict, Iran–Israel tensions) remaining unresolved, companies rationally assess the pause as potentially temporary.
- Infrastructure Lock-In and Port Investment: The Cape route and Indian Ocean corridors have attracted infrastructure investment and shipping company partnerships, making them partially self-sustaining. Port congestion in alternative hubs (Singapore, Suez, Port Said), feeder service development, and insurance market adaptation create path-dependent choices that persist even after threat levels decline.
- Persistent Insurance Premium Differential: Even with reduced attack frequency, insurance markets continue charging “war zone” surcharges for Red Sea transit, maintaining a cost differential between the Suez route and the Cape alternative that makes the longer route economically competitive for many operators.
- Underlying Geopolitical Drivers Remain Unresolved: The Hamas–Israeli conflict, Gaza internal terror crisis, and Iran–Israel strategic competition show no signs of fundamental resolution. Shipping companies, rationally, maintain precautionary rerouting as a hedge against renewed escalation.
Current Status: Crisis Transitioned to Structural Disruption (January 2026)
As of January 2026, the Red Sea crisis has entered a paradoxical state: hostilities have not resumed at the intensity of late 2023–early 2024, yet the global shipping network remains substantially reconfigured from pre-crisis patterns. This signals a transition from acute crisis to structural disruption—the Red Sea and Suez Canal no longer function as the seamless, neutral, and assumed-reliable corridor of prior decades.
Instead, the Red Sea has become a conditional route, accessed selectively and with sustained risk premiums. This structural shift has far-reaching implications for global trade costs, supply chain resilience, geopolitical positioning of maritime logistics, and development trajectories for vulnerable economies dependent on maritime trade.
1.3 The Houthi Movement: Non-State Actor, Proxy, and Autonomous Player
Understanding the Red Sea crisis requires sophisticated analysis of the Houthi movement—the non-state actor whose decisions and capabilities have reshaped global maritime commerce. The Houthis are neither a homogeneous puppet force controlled by Iran, nor an independent actor uninfluenced by regional powers. Rather, they represent a complex hybrid entity: a territorial movement with distinct political agenda, a capable military force armed and trained by Iran, and an ideological actor motivated by Zaydi revivalist Islam and anti-hegemonic regionalism.
Historical Origins and Political Development
The Houthi movement, officially known as Ansar Allah (“Helpers of God”), emerged from northern Yemen in the early 1990s as a moderate theological and cultural revival movement. Founded through an organization called “Believing Youth” (BY) in 1992 in Saada Governorate by members of the al-Houthi family—most prominently Hussein al-Houthi—the movement initially focused on religious education, establishing schools and summer camps to promote Zaydi Islamic teachings among Yemen’s Zaydi-majority communities (approximately 25–30% of Yemen’s population).
The movement underwent ideological and operational radicalization in the early 2000s, influenced by the 2003 U.S. invasion of Iraq and the organizational model of Lebanese Hezbollah. Beginning around 2003, Hussein al-Houthi began incorporating explicitly anti-American and anti-Israel rhetoric into sermons at Al-Saleh Mosque in Sanaa, disseminating the movement’s now-iconic slogan: “God is great, death to America, death to Israel, curse on the Jews, victory to Islam.” This religious positioning attracted government security attention. When Yemen’s President Ali Abdullah Saleh ordered al-Houthi’s arrest in 2003, al-Houthi refused submission and instead initiated an armed insurgency.
Yemeni government forces killed Hussein al-Houthi in September 2004, an event that transformed the movement from theological dissent into a sustained military rebellion. From 2004 to 2010, the Houthis conducted six rounds of major fighting (the “Saada Wars”) against Yemen’s central government, demonstrating organizational capacity, military resilience, and ability to mobilize local constituencies. Following the 2011 Yemeni Revolution and subsequent state collapse, the Houthis expanded territorially and consolidated power over northern Yemen’s most populous regions.
Leadership passed to Hussein al-Houthi’s brother, Abdul-Malik al-Houthi, who continues leading the organization today. Under Abdul-Malik’s leadership, the movement evolved from a primarily local and sectarian insurgency into a major regional political-military actor with significant territorial control (approximately 70% of Yemen’s population), explicit geopolitical ambitions, and increasingly sophisticated military capabilities.
Military Capabilities: Evolution and Iranian Support
The Houthi arsenal has evolved substantially from light infantry capabilities to a sophisticated military apparatus spanning ballistic missiles, cruise missiles, and unmanned systems.
Early Capabilities (2004–2014): During the initial insurgency phase, the Houthis relied primarily on light infantry tactics and small arms acquired through battlefield captures from Yemeni military forces. As Yemen’s central authority weakened between 2004 and 2010, the Houthis systematically looted military weapons caches, acquiring Scud ballistic missiles and OTR-21 Tochka tactical missiles originally supplied to Yemen during the 1994 civil war.
Iranian Strategic Support (2009–Present): Iranian backing emerged as the critical force multiplier in Houthi military development. While earlier interactions existed, Iran’s Islamic Revolutionary Guard Corps (IRGC) Quds Forcesubstantially increased military assistance beginning around 2009, accelerating dramatically after the Houthis’ takeover of northern Yemen in 2014–2015. This support included:
- Ballistic and cruise missile components, initially smuggled via maritime vessels to evade detection
- Unmanned aerial vehicle (UAV) technologies, including design plans and technical expertise
- Training and military advisory support through organizations like Hezbollah’s Unit 3800, which has trained Houthi personnel since approximately 2014–2015 in advanced weapon systems operation, naval tactics, and drone technologies.
- Intelligence sharing and target acquisition support through Iranian-flagged vessels positioned in the Red Sea and Indian Ocean to provide maritime surveillance.
Ballistic Missile and Drone Arsenal (2015–2025): From 2015 onwards, the Houthis unveiled an expanding arsenal of ballistic missiles and unmanned systems. By June 2019, the Houthis had launched a cumulative total of 226 ballistic missiles across their insurgency campaign. Drone operations peaked in 2021 with widespread targeting of Saudi oil infrastructure, notably the September 2019 Abqaiq–Khurais attack on Saudi Aramco facilities in eastern Saudi Arabia—while Houthis claimed responsibility, U.S. intelligence initially assessed Iranian direct involvement, though subsequent analysis credits Houthi capability given available training and organizational sophistication.
Naval Warfare Capabilities: Most relevant to the Red Sea crisis is the Houthis’ development of maritime attack systems. From 2015 onwards, the Houthis converted UAE-donated patrol boats into water-borne improvised explosive devices (WBIEDs), producing designs including the Tawfan-1, Tawfan-2, and Tawfan-3 classes capable of autonomous or remote operation with explosive payloads for ramming or detonation alongside larger vessels.
In October 2016, Houthi shore-based anti-ship missiles severely damaged the UAE Navy’s HSV-2 Swift, a hybrid catamaran, forcing its decommissioning. This demonstrated the Houthis’ evolution beyond small-craft tactics to employ sophisticated standoff anti-ship systems.
Most recently, Iran supplied longer-range anti-ship systems including Noor missiles (120 km), Qader missiles (200 km), and Khalij Fars ballistic anti-ship systems (300 km), unveiled during Houthi military parades in 2022–2024. Combined with target acquisition systems including coastal radar installations and intelligence-gathering vessels such as the Iranian-flagged MV Behshad (positioned off Eritrea), the Houthis possess technical apparatus for sustained anti-ship operations across vast Red Sea and Gulf of Aden areas.
Analytical Framework: Houthis as Multiple Actors
The Houthi movement occupies a complex analytical position, simultaneously functioning as:
1. A Strategic Instrument of Iranian Regional Policy: Evidence for Iranian strategic use is substantial. Iran’s provision of weapons, training, and intelligence through Quds Force and IRGC channels is well-documented by U.S. intelligence, UN reporting, and Saudi/UAE assessments. Iranian officials have openly stated their strategic rationale: Houthis serve as Iranian “proxy” force extending Tehran’s regional influence, analogous to Hezbollah’s role in Lebanon. Houthis’ 2023–2024 maritime attacks on commercial shipping aligned with Iranian interests in disrupting Western/Gulf-aligned commerce, elevating oil prices, and demonstrating Iran’s capacity to project power through non-state proxies. The timing—beginning immediately after October 7, 2023, Hamas attacks and Israeli Gaza invasion—suggests at minimum opportunistic coordination with Iranian strategic assessments.
2. An Autonomous Political-Military Actor: Yet characterizing the Houthis as merely Iranian instruments obscures their independent agency and distinct political agenda. The movement emerged from Yemen’s internal Zaydi political marginalization and sectarian dynamics, predating significant Iranian involvement by over a decade. The Houthis have repeatedly resisted Iranian pressure on specific operational decisions, negotiated for autonomy in tactical planning, and pursued political objectives (territorial consolidation, governance institutionalization in northern Yemen, resource control) independent of Tehran’s immediate interests.
The movement has constructed genuine institutional structures—media networks (Almasirah TV, 25+ publications), administrative governance organs in controlled territories, tribal consultation councils—reflecting authentic political consolidation, not merely external puppetry.
3. An Ideologically Motivated Resistance Movement: The Houthis’ framing of Red Sea attacks as “resistance to imperialism” and solidarity with Palestinian civilian victims reflected genuine ideological commitment, not merely cover for Iranian operations. The movement’s use of traditional Yemeni oral poetry (zawamil) infused with Houthi messaging, disseminated via social media, generated authentic grassroots mobilization resonating with constituencies beyond Iranian prompting.
Conclusion: The Houthis as Drivers of the Crisis
The Houthis’ decision to attack commercial shipping from November 2023 onwards reflects:
- Opportunistic alignment with Iranian strategic interests in disrupting global trade
- Autonomous political-military agency pursuing territorial and regional consolidation
- Ideological commitment to Palestinian solidarity and opposition to perceived U.S./Israeli hegemony
- Tactical calculation that maritime attacks impose costs on Israel’s strategic partners
- Demonstration of capability and deterrence signaling to rival Yemen factions and regional adversaries
This multiplicity of motivations explains the complexity: there is no single “off switch” for resolving the crisis. Military strikes on Houthi capabilities damage their arsenal but do not address underlying grievances or incentives. Iranian weapons provision continues even under military pressure. Addressing Palestinian–Israeli conflicts alone would not necessarily eliminate Houthi maritime operations, since these operations serve multiple strategic purposes for multiple actors.
1.4 Regional Drivers: Iran–Israel Confrontation, Yemen War, Gaza Conflict
The Red Sea crisis cannot be understood as an isolated maritime security incident. Rather, it emerges from a complex matrix of regional geopolitical tensions, proxy warfare dynamics, and unresolved conflicts spanning the Levant, Persian Gulf, and Arabian Peninsula. Three primary regional drivers structure the geopolitical environment enabling Houthi attacks:
The Iran–Israel Strategic Competition (2023–2025)
The broader Iran–Israel strategic confrontation, which intensified dramatically following the October 7, 2023 Hamas attack on Israel and Israel’s subsequent Gaza military campaign, provided the immediate geopolitical context enabling Houthi Red Sea operations.
The October 7, 2023 attack on Israeli territory, in which Hamas militants killed approximately 1,200 Israeli civilians and soldiers and captured roughly 240 hostages, triggered Israel’s military response: a sustained bombardment and ground invasion of Gaza that, by January 2026, had resulted in over 40,000 Palestinian deaths, widespread destruction of civilian infrastructure, and a humanitarian catastrophe characterized by acute food insecurity, disease outbreak risk, and psychological trauma affecting 2.3 million Palestinians.
The Gaza war, framed by Israel as necessary counterterrorism and by the Houthis and Iran as colonialism and genocide, became the explicit justification for Houthi maritime attacks. Houthi leadership, including Abdul-Malik al-Houthi, issued statements explicitly linking Red Sea attacks to Palestinian solidarity and opposition to Israeli military operations. This framing resonated throughout the Arab and Muslim world, generating grassroots support that extended beyond Iran’s direct strategic influence.
The Iran–Israel dimension intensified further with direct state-to-state escalation in April 2024 and again throughout 2024–2025. On April 14, 2024, Iran launched approximately 300 ballistic and cruise missiles and drones at Israeli territory in direct retaliation for the February 2024 Israeli airstrike on the Iranian embassy compound in Damascus (which killed senior IRGC general Mohammad Reza Zahedi). While Israel’s air defenses intercepted most missiles, the April 2024 attack represented unprecedented direct Iranian retaliation, marking a qualitative shift toward state-to-state confrontation.
Israel responded in kind, conducting airstrikes against Iranian military targets, including air defense systems and strategic assets. By late 2024–early 2025, the Iran–Israel strategic competition had evolved into a complex multi-front confrontation encompassing direct attacks, proxy warfare, cyber operations, and sanctions escalation. This strategic escalation created an environment in which Iran’s support for proxy forces (including the Houthis) became more strategically important as a means of imposing costs on U.S.-allied actors.
The Yemen Civil War as Proxy Battlefield (2014–Present)
The Houthi maritime attacks must be situated within the broader context of Yemen’s protracted civil war, which has been characterized as a proxy conflict between Saudi Arabia (backed by the United Arab Emirates and Western powers) and Iran.
Yemen’s civil war emerged from the collapse of Yemen’s weak central state, longstanding sectarian tensions between Sunni-majority and Zaydi Shia-plurality communities, and competing regional power interests. In 2014–2015, the Houthis consolidated control over northern Yemen (including the capital Sanaa) and much of the country’s most populous regions. Saudi Arabia, perceiving the Houthi advance as an extension of Iranian regional expansion, launched a military intervention in March 2015 with a coalition of Arab allies and Western logistical support.
The resulting war, described as among the world’s worst humanitarian crises, has killed approximately 300,000 Yemenis (directly and indirectly), displaced millions, and created widespread acute food insecurity affecting over 80% of Yemen’s population as of 2023–2025. The war has also destroyed Yemen’s central state capacity, educational and health infrastructure, and economic institutions, creating a de facto partition of Yemen into Houthi-controlled northern territories, internationally recognized government-controlled southern and eastern areas (backed variously by Saudi Arabia, the UAE, and other factions), and contested zones.
For Iran, the Houthi-controlled northern Yemen represents a valuable asset in its broader regional strategy: the Houthis provide Tehran with a foothold on the Arabian Peninsula, strategic leverage against Saudi Arabia (a regional rival), and a proxy force capable of imposing costs on Western and Gulf-aligned interests without direct Iranian military commitment. Iran’s military support to the Houthis, estimated at hundreds of millions of dollars annually, is a cost-effective investment in regional influence. For Saudi Arabia and the UAE, conversely, the Yemen conflict represents an existential regional security concern: preventing Iranian consolidation of power on the Arabian Peninsula’s southern flank.
The Yemen civil war has thus become embedded in the broader Saudi Arabia–Iran rivalry, which extends from Iraq and Syria through Lebanon. This Saudi–Iran proxy warfare dynamic underlies not only the Houthi attacks but also the regional fragmentation affecting global maritime commerce.
The Gaza Humanitarian Crisis as Ideological Catalyst (October 2023–Present)
The Gaza war, triggered by the October 7, 2023 Hamas attack, provided the immediate ideological and political catalyst for Houthi maritime escalation. While Iran’s strategic interests in disrupting global commerce and elevating costs for the U.S./Israeli alliance were evident, the Houthis’ explicit framing of Red Sea attacks as “solidarity with Palestinians” reflected genuine ideological motivation rooted in Zaydi Islamic anti-imperialism and pan-Islamic solidarity narratives.
The Gaza humanitarian crisis acquired particular salience in Arab and Islamic constituencies by late 2023–early 2024. As the Israeli military campaign progressed, civilian casualties mounted, and humanitarian conditions deteriorated (with acute food insecurity, disease risks, and displacement of civilian populations). International humanitarian organizations (in many cases questioned for their lack of neutrality and for having members linked to terrorism) including the United Nations, the International Committee of the Red Cross, and Doctors Without Borders documented supposed systematic destruction of civilian infrastructure, denial of humanitarian assistance, and conditions approaching famine in parts of Gaza. Something that was used to glorify the attacks rather than to curb collateral damage in the conflict, constituting a violation of the IHL.
For the Houthis, this humanitarian catastrophe provided a powerful legitimizing narrative for Red Sea operations. Unlike abstract anti-imperialism, the Palestinian issue resonates with deep emotional and religious significance throughout Muslim-majority societies. Houthi framing of the Red Sea attacks as “resistance” to Israeli expansion and U.S. hegemony generated grassroots support within Yemen and broader Arab constituencies that transcended Iran’s strategic interests.
This ideological dimension explains why military defeats of Houthi capability (through U.S./coalition airstrikes) and pauses in Iranian resupply have not eliminated Red Sea attacks: the movement possesses autonomous motivation distinct from Iranian strategic direction. Equally, it explains why the Gaza ceasefire negotiated in October 2025 led to a Houthi operational pause—when the immediate humanitarian crisis receded somewhat, the primary ideological justification for attacks weakened.
Synthesis: Interconnected Regional Drivers
The Red Sea crisis emerges from the intersection of these three regional dynamics:
- Iran–Israel strategic competition provides structural incentive for disruption of global commerce benefiting Western/Allied actors
- Yemen’s protracted civil war provides organizational infrastructure and territorial control enabling Houthi maritime operations
- Gaza humanitarian crisis provides ideological legitimacy and grassroots mobilization fuel for attacks
These three drivers are not independent but rather reinforcing. Iran’s strategic interests align with genuine Houthi autonomy and grassroots Arab sentiment regarding Palestine. Yemen’s territorial fragmentation enables Houthi operational independence. The Gaza crisis provides real humanitarian justification transcending proxy warfare reductionism.
This synthesis explains why the Red Sea crisis is not a simple puzzle with a single solution. Addressing one driver alone—through military pressure on Houthis, diplomatic intervention in Yemen, or ceasefire agreements regarding Gaza—proves insufficient without simultaneously addressing the others.
1.5 Quantifying the Disruption: Traffic, Costs and Freight Rate Dynamics
The Red Sea crisis, while politically and geopolitically significant, is perhaps most dramatically illustrated through quantitative analysis of shipping volumes, freight rates, and operational costs. These metrics translate abstract geopolitical analysis into concrete economic impacts affecting supply chains, inflation, and development trajectories globally.
Shipping Volume Collapse and Recovery
Phase 1 (November 2023–February 2024): Acute Disruption
The immediate impact of Houthi attacks on shipping volumes was severe and near-total:
- Bab el-Mandeb daily transits: Collapsed from ~70 vessels/day (pre-crisis baseline) to ~35 vessels/day (50% reduction)
- Red Sea overall traffic: Declined 57.5%, from 4.0 million metric tons/day to 1.7 million metric tons/day
- Suez Canal container transits: Experienced 90% decline between December 2023 and March 2024
- Cape of Good Hope traffic: Surged 74% above prior-year levels as diversions accelerated
These volume contractions were not gradual declines but rather sharp cliff-edge collapses, reflecting the immediate risk reassessment by shipping operators following the first coordinated Houthi attacks.
Phase 2 (March 2024–September 2025): Stabilized Suppression
During this extended period, Red Sea traffic remained persistently suppressed at 35–40% of pre-crisis baselinesdespite reduced attack frequency. This “sticky” suppression—failure to recover despite reduced threats—illustrates the importance of sustained confidence in maritime security. Shipping operators, having reorganized logistics networks and supply chains around the Cape route, did not immediately reverse course:
- Suez Canal monthly transits: By October 2025 (after the Gaza ceasefire), monthly transits reached 229 vessels—described as the “highest monthly figure since the crisis began,” yet still representing suppressed overall volumes compared to 2023
- Red Sea traffic: Remained at approximately 60% below pre-crisis levels as of January 2026
- Cape of Good Hope: Maintained elevated traffic levels, absorbing rerouted commerce
Phase 3 (October 2025–January 2026): Tentative Recovery with Persistent Suppression
The October 2025 Gaza ceasefire and Houthi announcement of an operational pause created the first significant uptick in Red Sea transits since the crisis began:
- Suez Canal revenues: Rose 14.2% year-over-year between July–October 2025
- Monthly vessel transits: Increased to 229 in October 2025
- Quarterly volumes (July–October 2025): 4,405 vessels carrying 185 million metric tons, compared to 4,332 vessels with 167.6 million tons during the same period in 2024
However, even this recovery remained modest. Red Sea traffic in January 2026 continued at approximately 60% below pre-crisis levels, demonstrating that partial threat reduction is insufficient to restore full shipping confidence.
Freight Rate Dynamics: The Financial Impact
The disruption of shipping volumes directly translated into elevated freight rates across major trade routes, with Asia–Europe and Asia–Mediterranean routes experiencing the most dramatic increases:
Phase 1 (December 2023–July 2024): Rate Spike
From the onset of disruptions through the summer peak season of 2024, container freight rates experienced historic spikes:
- Shanghai to Rotterdam (Asia–Europe): Rates tripled from typical $1,500–1,700/FEU (20-foot equivalent unit) pre-crisis to $5,500/FEU by February 2024; peaked at $8,400/FEU in July 2024
- Shanghai to Mediterranean: Rates more than tripled, reaching approximately $6,500/FEU by mid-2024
- Shanghai to U.S. West Coast: Rates increased to $3,715/FEU, 49% above pre-Red Sea crisis levels of $2,500/FEU
- Shanghai to U.S. East Coast: Similar increases, with rates reaching $3,000/FEU
These rate increases reflected not only the direct cost of rerouting (longer distance, additional fuel) but also the scarcity of vessel capacity. As vessels were absorbed into longer-distance Cape routing, the available capacity for traditional routes contracted sharply, creating a capacity shortage that dramatically elevated rates.
Phase 2 (August 2024–September 2025): Rate Normalization with Elevated Baseline
From August 2024 onwards, freight rates eased from their July 2024 peak but stabilized at levels substantially above pre-crisis benchmarks:
- Asia–Europe rates: Settled at approximately $3,300–3,500/FEU by late 2024, representing 100–130% above pre-crisis levels (compared to pre-December 2023 rates of $1,500–1,700/FEU)
- Rate persistence: Contrary to expectations that rates would collapse once initial disruption was managed, they remained elevated throughout the extended disruption period, as supply-demand imbalances persisted
- Capacity management: Shipping lines employed capacity management strategies (blanking sailings, vessel repositioning) to maintain rate levels despite reduced demand in some markets
Phase 3 (October 2025–January 2026): Modest Rate Decline but Sustained Elevation
Following the Gaza ceasefire and tentative Red Sea recovery, freight rates declined modestly but remained well above pre-crisis baselines:
- Far East to North Europe: $2,100/FEU (as of late 2025), representing 39% above December 1, 2023 baselineof $1,506/FEU
- Far East to Mediterranean: $3,125/FEU, representing 68% above baseline of $1,857/FEU
- Transpacific rates: Approximately $2,274/FEU, compared to pre-crisis baseline of $1,643/FEU—a 38% premium
Importantly, even after 15 months of reduced threat levels and the Gaza ceasefire, rates remained significantly elevated, illustrating the persistence of geopolitical risk premiums in maritime commerce.
Operational Cost Analysis: The Per-Voyage Impact
Beyond freight rates (pricing for shipping services), the Red Sea crisis directly increased operational costs for vessel operators through fuel consumption, crew expenses, and opportunity costs:
Fuel Costs:
The extended voyage via the Cape of Good Hope requires substantially additional fuel:
- Distance increase: Cape route adds 3,500–4,000 nautical miles compared to Suez routing
- Fuel consumption increase: Large container vessels (15,000+ TEU) require approximately 800–1,300 tons additional fuel per voyage on the Cape route
- Fuel cost impact: At VLSFO (very low sulfur fuel oil) prices of $650/ton (2025 levels), this translates to $500,000–$900,000 additional fuel cost per voyage
- Total per-voyage additional fuel cost: Approximately $1–1.5 million depending on vessel size and fuel prices
Direct Additional Costs Per Voyage (Cape Route vs. Suez):
| Cost Component | Annual Impact (Large Container Vessel) |
|---|---|
| Fuel cost increase | $200,000–400,000 per voyage or $3–5 million annually |
| Crew wages (extended voyage) | $50,000–100,000 per voyage or $1–2 million annually |
| Insurance premium differential | Varies; Red Sea route higher during crisis ($300K–500K premium) but Cape route lower in normal markets |
| Suez Canal fees avoided | -$500,000–700,000 (offset against Cape costs) |
| Total net annual cost increase | $1–3 million per vessel depending on voyage frequency and rate structure |
Opportunity Costs and Fleet Efficiency:
The extended 10–14 day transit time for Cape routing reduces annual vessel productivity:
- Voyage reduction: 20% fewer annual Asia–Europe round-trip voyages (14–15 voyages/year vs. 17–18 voyages/year on Suez route)
- Revenue impact: For a 15,000 TEU vessel earning $50,000–70,000/day in charter rates, this represents $3–5 million in forgone annual revenue per vessel
- Fleet-wide impact: With approximately 10,000+ container vessels on Asia–Europe routes, the opportunity cost to the global shipping industry is estimated at $20–40 billion annually during disruption periods
Global Economic Impact and Inflation Transmission
The freight rate and operational cost impacts translated directly into global inflationary pressures:
Transmission Mechanisms:
- Import Price Inflation: According to IMF analysis, a doubling of maritime transport costs results in a 0.7 percentage point increase in global consumer price index and 0.3–0.5 percentage point increase in headline inflation
- Supply Chain Cost Pass-Through: Freight rate increases are rapidly transmitted to retail prices for imported goods. Studies indicate that 70–85% of freight cost increases pass through to consumer prices within 6–12 months, particularly for non-commodity goods (electronics, apparel, furniture)
- Developing Country Vulnerability: Small island developing states (SIDS) and least developed countries (LDCs) face disproportionate inflation impacts, as transport costs may constitute 8–12% of total import value(compared to 2–3% for developed economies). For countries like Mauritius, Fiji, and Bangladesh, the Red Sea disruption directly contributed to inflation rates 3–5 percentage points above developed country benchmarks in 2024
Quantified Global Impacts (2024–2025):
- Global supply chain cost increase: Estimated at $15–20 billion annually while Red Sea disruption persists
- Food price inflation contribution: The disruption contributed approximately 0.3–0.5 percentage points to global food price inflation in 2024, particularly affecting grain prices (wheat, rice) flowing through the corridor
- Manufacturing cost inflation: Semiconductor and electronics supply chains experienced 10–15% cost increases attributable partly to elevated freight rates and extended supply chain times
- Developing country inflation: LDCs experienced 0.5–1.5 percentage point higher inflation attributable to Red Sea disruption, with particular impact on food and energy-importing nations
Quantitative Synthesis: The Scope of Disruption
The Red Sea crisis, quantified comprehensively, represents:
- 52.5% reduction in Red Sea/Suez Canal traffic (from baseline to lowest point in early 2024)
- Sustained 60% suppression of traffic as of January 2026 despite ceasefire announcements
- Freight rate increases of 100–350% on primary Asia–Europe and Asia–Mediterranean routes during peak disruption
- $1–3 million per vessel additional operational costs on Cape routing
- $15–20 billion annual global supply chain cost increase
- 0.3–0.5 percentage point contribution to global inflation in 2024–2025
- Disproportionate impact on developing countries, with LDCs and SIDS experiencing 0.5–1.5 percentage point additional inflation
These quantitative impacts demonstrate that the Red Sea crisis, while originating in regional geopolitical tensions between Iran, Israel, and Yemen’s internal conflict, has become a major driver of global economic disruption, supply chain fragmentation, and inflationary pressures affecting all economies.
2: Restructuring Global Shipping Networks
2.1 The Cape of Good Hope Detour: From Emergency Response to Structural Baseline
The immediate shipping industry response to Houthi attacks in late 2023 was dramatic and decisive: diversion away from the Red Sea and Suez Canal. What began as an emergency rerouting decision evolved within months into a structural reorganization of global shipping networks. By January 2026, the Cape of Good Hope route has become embedded into carrier operating strategies, functionally equivalent to pre-crisis baselines regardless of formal threat assessments.
Volume Surge and Persistent Elevation
Cape traffic surged 191% above 2023 levels by 2024, with approximately 80% of container liners operating on Cape-based routing by mid-2024. In contrast, Suez Canal traffic collapsed 57.5% from baseline 4.0 million metric tons per day to 1.7 million metric tons. This volume shift was accompanied by a broader supply chain lengthening: global ton-miles increased a record 6% in 2024, representing nearly three times faster growth than actual trade volume (2.2%)—indicating structural supply chain extension rather than demand growth.
As of January 2026, despite the Gaza ceasefire (October 2025) and reduced Houthi attack frequency, Red Sea traffic remains approximately 60% below pre-crisis levels, with most Asia-Europe services continuing via Cape routing. This persistence of rerouting despite reduced threat frequency indicates that shipping companies have reorganized their infrastructure around the extended route, making rapid reversions economically suboptimal.
Distance and Time Dimensions
The Cape of Good Hope routing fundamentally extends global supply chains:
- Shanghai to Rotterdam: Suez route requires 11,000 nautical miles and 28 days; Cape route requires 15,000+ nautical miles and 40 days
- Distance penalty: 4,000+ additional nautical miles extending voyages by approximately 40%
This extension reduces vessel carrying capacity on an annual basis:
- Annual voyage capacity declines approximately 20% per vessel on Cape routing compared to Suez
- A 20,000 TEU vessel conducting 15 Suez voyages annually (28-day cycle) yields only 12 Cape voyages annually (40-day cycle)
- At typical charter rates of $50,000–$70,000/day, this represents $3–5 million in forgone annual revenue per vessel
Operational Cost Structure: Fuel, Insurance, and Crew
The Cape route imposes substantial cost burdens that sustain rerouting even as threat levels decline:
Fuel Costs:
- Additional consumption: 800–1,300 metric tons per voyage
- At 2025 VLSFO pricing (~$650/ton): $500,000–$850,000 additional cost per voyage
- Annual impact per large vessel: $6–10.2 million (based on 12 annual voyages)
- Fleet-wide aggregate (3,000–4,000 container vessels): $18–40 billion annually during sustained rerouting
Crew and Operational Expenses:
- Extended voyage duration adds $50,000–$100,000 in crew costs per voyage
- Annual impact per vessel: $600,000–$1.2 million
- Suez Canal transit fees avoided (partial offset): $300,000–$700,000 per passage
Net Cost Premium:
Aggregate operational costs per Cape voyage exceed Suez routing by $1–3 million per vessel, depending on fuel prices and charter rates.
Container Losses and Safety Hazards
The concentrated shift to Cape routing has increased maritime casualties. The Cape region experiences hazardous conditions—the Roaring Forties and Furious Fifties latitudes create sustained rough seas and extreme weather that pose risks even to modern vessels.
2024 container loss data:
- 576 containers lost overboard globally in 2024, more than double the 221 lost in 2023
- 35% of global container losses in 2024 occurred at the Cape of Good Hope, approximately 200 containers
- Three major incidents at the Cape involved losses of 44, 46, and 99 containers respectively
- The surge was “driven in large part by disruptions to trade through the Red Sea, where persistent attacks prompted global carriers to divert traffic to the Cape of Good Hope”
This concentration reflects both the volume surge and the hazardous environmental conditions. While absolute losses remain below historical averages, the regional concentration and year-over-year doubling signal that Cape routing carries operational safety risks factored into carrier decision-making.
2.2 Dual-Route Equilibria: Risk, Insurance, and Carrier Strategies
Despite apparent Cape dominance, the global shipping network has not bifurcated into a single route. A dual-route equilibrium has emerged: the Suez Canal receives selective traffic while the Cape route dominates volume, creating a conditional pricing structure fundamentally different from pre-crisis patterns. Carriers employ mixed routing strategies reflecting risk-adjusted economics and unresolved geopolitical conditions.
War Risk Insurance as the Structural Cost Driver
The most consequential structural change is maritime war risk insurance repricing. War risk premiums—charged as a percentage of hull and machinery value per voyage—have become the effective mechanism making the Cape route economically competitive with the Suez route despite its operational inefficiency.
War Risk Premium Evolution:
| Region/Route | Pre-2023 | Peak 2024 | Current 2025 | % Increase |
|---|---|---|---|---|
| Red Sea transit | 0.10% | 1.0% | 0.75% | +650% |
| Gulf of Aden | 0.05% | 1.0% | 0.40% | +700% |
| Suez approach | 0.02% | 0.50% | 0.15% | +650% |
| Persian Gulf | 0.20% | 0.50% | 0.50% | +150% |
| Cape of Good Hope | 0.05% | 0.15% | 0.10% | +100% |
Sources: UK P&I Club data, Freightamigo 2025, Lloyd’s Market Association
The critical finding: Red Sea war risk premiums remain at 0.75% even after the October 2025 ceasefire, representing 5 times higher than pre-2023 baseline levels. This sustained elevation persists despite reduced threat frequency, indicating that insurance markets price the risk as structural rather than temporary.
Per-Voyage Financial Translation:
For a 20,000 TEU container vessel (hull/machinery value ~$165M):
- Red Sea Suez-route premium: 0.75% × $165M = $1.24M per voyage
- Cape-route premium: 0.10% × $165M = $165K per voyage
- Insurance differential: $1.075 million per voyage favoring the Cape route
This insurance cost advantage alone makes Cape routing economically competitive despite additional fuel and crew expenses. The insurance repricing has transformed Cape routing from a temporary disruption response into a structurally sustainable alternative.
Carrier Routing Strategies: Selective Suez Operations and Mixed Portfolios
Major shipping lines (Maersk, MSC, CMA CGM, Hapag-Lloyd) have not adopted uniform strategies. Instead, they employ mixed portfolio approaches:
- Cape-routed services form the primary Asia-Europe backbone (70–80% of scheduled sailings)
- Selective trial transits through Suez occur during perceived geopolitical calm periods
- Both routes are maintained to allow customer choice and risk allocation
- Voyage-by-voyage decisions adjust routing based on real-time threat assessments
This mixed strategy reflects rational risk management: maintaining Suez services preserves optionality if geopolitical conditions stabilize and war risk premiums normalize, while concentrated Cape routing insulates carriers from escalation risks. Offering both routes allows carriers to segment demand—risk-averse shippers pay premiums for faster Suez transit; price-sensitive shippers accept longer Cape voyage durations.
Evidence of Mixed Routing:
Suez Canal monthly transits reached 229 vessels in October 2025 following the Gaza ceasefire but recovered only to 50–60% of 2023 baseline traffic. This represents recovery overlay rather than route reversal: carriers are adding selective Suez services atop stabilized Cape operations rather than abandoning the extended route.
Risk Perception vs. Risk Reality: Why Rerouting Persists
Despite attack frequency declining from daily (January–February 2024) to sporadic (March–September 2025) to announced pause (October 2025–present), carrier risk perception has not normalized. This divergence reflects three structural factors:
1. Geopolitical Driver Persistence: The Gaza conflict and Israel–Palestine tensions remain unresolved, with no clear pathway to fundamental de-escalation. Carriers rationally assess the current operational pause as potentially temporary rather than permanent, maintaining precautionary routing strategies.
2. Houthi Capability Demonstration: Over 190 documented maritime attacks have established that the movement possesses sustained military capability independent of Iran’s immediate strategic direction. This demonstrated capacity enables rapid renewed escalation from operational pause states.
3. Insurance Market Ratchet Effect: War risk insurance remains repriced at elevated levels even during low-threat periods. Carriers must internalize elevated premiums regardless of attack frequency, and insurance markets normalize rates only when threats are perceived as eliminated, not merely suspended.
The combined effect shifts routing from threat-responsive (attack frequency-driven) to strategy-responsive (geopolitical incentive-driven). Carriers plan Cape-dominant networks because underlying geopolitical incentives for Houthi action—Palestinian solidarity, opposition to regional hegemony, Iranian strategic interests—remain structurally unresolved.
2.3 Port and Corridor Winners and Losers in Africa, Europe, and Asia
The Cape-dependent restructuring has produced highly asymmetric impacts on port development and regional competitive positioning. Some corridors experience unprecedented growth while others face structural disadvantage.
Winners: West African Ports and Transhipment Network Emergence
West African ports (Tema, Abidjan, Lomé, Kribi) have benefited from a unique geographic advantage: vessels rerouting around Africa necessarily traverse West African waters and can access these ports with minimal distance penalty compared to alternative Mediterranean transhipment routing.
Quantified Growth:
- West African container trade: ~50% expansion in less than a decade
- First-half 2025: Volumes surged 30% compared to same period 2024
- Broader Africa: Container traffic grew 57% in recent years, second only to Asia’s 64% growth
- ULCV capability deployment: MSC’s April 2025 deployment of 24,000 TEU mega-ships to West African ports (MSC Diletta inaugurating service April 23, 2025) marked structural capacity threshold achievement
Infrastructure Modernization:
Historically seen as secondary markets, West African ports have upgraded rapidly:
- Maersk terminals in Abidjan and Tema validated for 20,000+ TEU vessel handling
- MSC redesigned the Africa Express Service (April 2025) to accommodate 24,000 TEU vessels, enabling direct transhipment from Asia without Mediterranean intermediate stops
- Ports upgraded terminal infrastructure including ship-to-shore cranes, yard expansion, and reefer connectivity
Transhipment Network Restructuring:
The innovation is that West African ports now function as viable transhipment hubs for Asia–West Africa and Asia–Europe business, eliminating dependency on distant Mediterranean centers. Vessels on Cape-routed services no longer require Mediterranean transhipment before serving West African markets, reducing inventory carrying costs and supply chain complexity.
Competitive Impact on Mediterranean Hubs:
West Mediterranean calls to West Africa declined from 69 calls (Q3 2023) to 41 calls (Q3 2025), a 40% reduction, representing 34.6% capacity loss in allocated transhipment services.
Winners: East African Ports and Indian Ocean Corridors
East Africa:
Ports of Dar es Salaam (Tanzania) and Mombasa (Kenya) attract substantial investment as Cape routing gateway infrastructure:
- Tanzania: Container traffic growing 12.5% CAGR, reaching 236,458 TEU
- Kenya: Exports 188,748 TEU with 6.8% CAGR
- Intra-African trade: 12.4% year-over-year growth, partly driven by improved regional port connectivity
- Infrastructure expansion: Major capacity-doubling projects underway, with combined East African growth forecast of +15–20% in 2026, potentially reaching 1.5–1.7 million TEU combined throughput
Salalah, Oman:
Port of Salalah presents mixed performance—container volumes declined but general cargo surged:
- Q1 2025: Container throughput 823,000 TEU, down 6% from 878,000 TEU (Q1 2024)
- General cargo surge: Terminal handled 6.4M tons (2025) vs 5.8M tons (2024), a 11% increase
- 9-month performance (ending Sept 2025): 3.2M TEU, up 26% from 2.5M TEU prior year, indicating recovery momentum
- Infrastructure completion: $300 million expansion with 10 next-generation ship-to-shore cranes and 2,000 reefer plugs
Indian Ports:
India’s positioned on the Cape-routed Asia–Europe corridor:
- Container traffic: Increased from 8.20M TEU (FY16) to 12.28M TEU (FY24), a 7.7% CAGR
- Major port expansions: JNPT, Mundra, Chennai, and Visakhapatnam implementing 20–30% capacity increases over two years, with long-term capacity target exceeding 50 million TEU within five years
- Trade lane growth: India-Southeast Asia traffic accelerating as “China+1” manufacturing diversification intensifies
Winners: Alternative Mediterranean and Atlantic Gateway Ports
Mediterranean ports have adapted by positioning as secondary gateways rather than primary transhipment hubs:
- Port of Valencia (Spain): 3.4% growth in container traffic (2025), with exports up 5.56% and imports up 15.55%
- Genoa (Italy): Handling increased diverted Asia-Europe trade flows
- Tangier Med (Morocco): Positioned as alternative European entry point
Northern Atlantic-facing ports retain importance for inland connectivity to Central European hinterlands despite congestion pressures.
Losers: Singapore Port Congestion Paradox
Singapore, the world’s second-largest container port and primary Asia–Europe transshipment hub, experienced paradoxical challenges. Rather than benefiting from increased traffic, acute congestion emerged due to specific network restructuring patterns:
Congestion Metrics:
- Peak congestion: “Worst since COVID-19 pandemic” levels
- Average cargo offload volume: Increased 22% during January–May 2024
- Vessel docking delays: 2–3 days typical (normal: <1 day), extending to one week during peaks
- Schedule reliability: 90% of vessels arriving off-schedule vs 77% baseline
- Throughput paradox: Port handled record-breaking 37.3 million TEU in 2024, yet operational efficiency declined sharply
Causal Mechanism:
Congestion resulted not from demand increase but from intentional network redesign: carriers discharge larger cargo volumes at Singapore and skip subsequent scheduled ports to recover schedule delays. This creates a functional reduction in transshipment capacity despite increased throughput, generating demurrage and detention costs.
Port Authority Response:
Singapore implemented adaptive measures including reopening older berths, approving night-tow operations, and planning additional Tuas Port capacity. These measures partially mitigated congestion by early 2025.
Losers: Egyptian Suez Canal Authority and Northern European Ports
Suez Canal Revenue Collapse:
Egypt faced catastrophic revenue decline:
- FY 2024/2025 revenues: $3.6 billion, a 45.5% decline from $6.6 billion prior year
- For Egypt, a nation with persistent fiscal vulnerabilities and foreign exchange constraints, this revenue loss created immediate fiscal crisis pressures constraining public investment capacity
Northern European Port Congestion:
Rotterdam, Antwerp, Hamburg, and Bremerhaven experienced severe congestion as Cape-routed vessels arrived simultaneously with peak-season demand:
- Berth waiting time increases: 37–77% average increases as of June 2025
- Typical delays: 48–72 hours (historical baseline: 12–24 hours)
- Carrier response: Maersk excluded Rotterdam from certain service loops and redirected to Hamburg, implementing €10/TEU transshipment surcharges
Congestion reflects a fundamental collision between port infrastructure capacity and demand volatility: extended Cape routes create unpredictable arrival patterns that overwhelm terminals designed for stable traffic flows.
2.4 Implications for Supply Chain Resilience and Lead Times
The Cape routing restructuring generates contradictory implications for supply chain resilience. While diversifying away from Suez chokepoint dependency, it extends supply chain durations and creates new vulnerabilities related to congestion, weather hazards, and operational complexity.
Lead Time Extension and Supply Chain Duration
The 10–14 day ocean transit extension translates into measurable supply chain implications:
Manufacturing and Production Planning:
- Extended lead times: From 42–50 days (Suez-based) to 52–64 days (Cape-based)
- Buffer stock increases: Manufacturers building larger inventory buffers to account for extended uncertainty, representing $3–8 billion annual capital costs across global manufacturing
- Production schedule complexity: Extended lead times require earlier procurement decisions, reducing flexibility to respond to demand changes
Perishable and Time-Sensitive Goods:
- Spoilage risk: Increases approximately 15–25% for every 10-day transit extension on fresh produce routes
- Pharmaceutical supply chains: Cold-chain shipments (vaccines, biologics) face elevated temperature exposure during extended voyages, potentially reducing product efficacy
- Food security: Extended supply chain times and elevated freight costs contributed measurably to global food price inflation in 2024–2025
E-commerce and Fast Fashion:
Extended lead times undermine speed-to-market competitive advantage. Seasonal goods (fashion, electronics) arriving after peak-demand windows face steep markdowns; customers experience delivery delays affecting satisfaction metrics.
The Early Arrival Paradox
A counterintuitive challenge emerges as carriers selectively trial Suez routing (late 2025). The transition from Cape-length to Suez-length lead times (10–14 days faster) creates operational disruptions rather than improvements for unprepared distribution centers.
The Mechanism:
When a carrier shifts a service loop from Cape to Suez, ocean transit compresses by 10–14 days. However, inland distribution centers may not be prepared for accelerated arrival timing:
- Distribution centers planned around Cape-length lead times face containers arriving 1–2 weeks earlier than scheduled dock slots and labor planning
- Early arrivals overwhelm available dock positions, warehouse space, and labor scheduling
- Detention and demurrage costs accumulate—often $500–1,500 per container for extended stays
- Shippers face unexpected costs when goods arrive outside prepared receiving windows
Supply Chain Ripple Effects:
Lead-time compression creates bottlenecks throughout integrated logistics networks: feeder services, railroads, and trucking operations optimized for longer lead times face schedule crowding when ocean services accelerate; warehouse utilization rates spike temporarily, creating capacity shortages.
Ton-Miles and Aggregate Supply Chain Efficiency
Ton-miles—distance each ton of cargo travels globally—captures aggregate supply chain lengthening independent of volume changes:
- 2024 ton-miles increase: Record 6% increase, nearly three times faster than trade volume growth (2.2%)
- Implication: The global supply chain lengthened substantially not because trade exploded, but because existing volumes traveled much longer distances on average
- Sustainability consequence: Longer supply chains translate directly into higher aggregate maritime emissions
Resilience Trade-Offs: Geopolitical Diversification vs. Environmental Vulnerability
Resilience Benefits:
Cape routing reduces dependency on a single chokepoint (Suez Canal) representing structural vulnerability:
- Geographic diversification: Shipping distributed across Southern Ocean, Indian Ocean, and Atlantic reduces exposure to single-point geopolitical disruption
- Reduced state leverage: No single nation controls the Cape or Southern Ocean routing, reducing interdiction risk compared to Egypt’s control of Suez
- Route redundancy: Multiple alternative ports (West Africa, East Africa, Indian Ocean) provide operational flexibility absent under Suez-dominant structures
Resilience Vulnerabilities:
Cape routing introduces environmental exposure underming long-term resilience:
- Container loss concentration: 35% of 2024 global losses occurred at Cape, driven by hazardous weather conditions
- Schedule reliability degradation: Roaring Forties and Furious Fifties latitudes create restricted sailing windows, compressing available operational schedules
- Climate vulnerability: Southern Ocean warming is altering current patterns and creating new navigation hazards; regulatory pressures on polar operations are increasing
Supply Chain Resilience Paradox: Reducing geopolitical chokepoint vulnerability has been achieved by accepting increased environmental vulnerability and longer supply chains subject to increased spoilage and inventory costs.
Risk Distribution Across Supply Chain Tiers
The restructuring creates concentrated risks at specific tiers:
Tier 1 (Shipping Companies): Large carriers absorb cost premiums through scale economies and service segmentation.
Tier 2 (Port Operators & LSPs): Mid-sized operators face congestion and must invest in adaptive infrastructure, creating capital pressures.
Tier 3 (Small & Medium Shippers): Smaller importers/exporters face elevated uncertainty, inventory carrying, and spoilage costs with limited ability to diversify routing or negotiate favorable insurance terms.
3: Emerging Polar and Southern Maritime Frontiers
3.1 The Arctic Sea Route: Climate Openings and Geopolitical Gatekeeping
The Arctic Sea Route (ASR)—also referred to as the Northern Sea Route (NSR) along Russia’s northern coastline, the Northeast Passage, and increasingly the Central Arctic Route—is transitioning from theoretical maritime curiosity to operational shipping corridor as climate change melts Arctic sea ice. This transition, driven by polar warming occurring at nearly four times the global average rate, represents a fundamental restructuring of intercontinental maritime networks and introduces new geopolitical power dynamics centered on Arctic gatekeeping.
Climate-Driven Ice Melt and Navigation Windows
Arctic warming is creating unprecedented accessibility to previously inaccessible passages:
- Arctic warming rate: Nearly 4 times the global average, reducing summer sea ice extent by approximately 40% since 1979
- Ice-free period expansion: Scientists project the Arctic will be essentially ice-free during summer months by approximately 2050, with 3 months of nearly open navigation (August–October) by 2050, expanding to 5 months (July–November) by 2070
- Current navigability: The NSR is now seasonally viable during July–November, with container services successfully operating during this window
- Central Arctic Route viability: The Central Arctic Route across the top of the Arctic may become viable by mid-century, offering even greater distance reductions compared to the NSR
Climate projections indicate substantial variation in timing depending on emission scenarios. Under moderate climate action (RCP 4.5 scenario), the Arctic could experience one month of nearly ice-free conditions (September) by 2030–2040, expanding to multiple months by mid-century. Under high-emission scenarios (RCP 8.5), ice-free conditions could be achieved several years earlier.
Distance Advantage and Transit Time Reduction
The Northern Sea Route offers compelling distance and time advantages compared to traditional Suez-routed passages:
- Shanghai to Rotterdam via NSR: Approximately 20 days transit (compared to 28–40 days via Suez or Cape of Good Hope)
- Distance reduction: Up to 40% shorter distance between Europe and Northeast Asia, depending on specific route configuration
- Fuel cost advantage: Cost reductions estimated at 50–70% during prime navigation periods (September, when ice conditions are most favorable), with 80–90% reductions in emissions compared to Suez Canal routes
- Travel time compression: Reduction of 7–20 days compared to traditional Suez routing
These advantages create powerful economic incentives for Arctic routing once navigation becomes seasonally reliable. A single Asia–Europe transit saves approximately 4,000–5,000 nautical miles compared to Suez routing and 8,000+ nautical miles compared to Cape routing, translating directly into fuel savings and schedule compression.
Operational Viability and Current Activity
The Arctic Sea Route has transitioned from theoretical possibility to operational reality, particularly for Russian resource exports and increasingly for Chinese container operations:
2024–2025 Activity Levels:
- 2025 transit voyages: 103 total NSR transits in 2025, up from approximately 75–80 in prior years
- Chinese container voyages: 14 container ship voyages in 2025, a 27% increase from 11 in 2024 and a 100% increase from 7 in 2023
- Containerized cargo volume: Approximately 400,000 tons via NSR in 2025, a 2.6-fold increase compared to 2024
- Total NSR cargo volume: 3.2 million tons in 2025, with 97% moving eastward (Russia to China), primarily crude oil, LNG, and bulk cargo, with containers representing a growing share
- Cargo composition (2025): Crude oil tankers (1.83 million tons), LNG carriers, bulk cargo, and containers (400,000 tons)
Recent Milestones:
- NewNew Shipping Arctic Express N1 service: Commenced operations July 2024, connecting Shanghai/Ningbo to Arkhangelsk, with 13 successful voyages in 2024 carrying 20,000+ TEU and expanded to 5 vessels with permits in 2025
- First Chinese container vessel via NSR (2025): The Newnew Polar Bear departed Shanghai July 16, 2025, and arrived in Arkhangelsk in less than a month, delivering 497 containers
- Arkhangelsk capacity expansion: Expects 20 Chinese vessel calls in 2025 (double 2024 levels), with NewNew Shipping investing $2.5 billion in port expansion
- Turkish bulk carrier milestone (October 2025): The Istanbul Bridge completed the first non-Russian operated vessel to transit NSR via Chinese operation, demonstrating internationalization of Arctic shipping
Seasonal Constraints and Reliability Challenges
Despite operational progress, the Arctic Sea Route remains constrained by seasonal and safety factors that limit immediate scalability:
Seasonal Navigation Windows:
Arctic ice conditions remain highly variable by location and year:
- Consistent navigability: Only September currently offers nearly consistent open-water conditions across all NSR subregions, with approximately 90% safety assessment
- Extended windows: By 2050, researchers project August–October will be reliably navigable for ice-strengthened vessels
- Inter-annual variability: The ice-free period varies substantially year-to-year, ranging from 6 weeks to 4+ months depending on atmospheric conditions, creating schedule uncertainty
Infrastructure and Emergency Response Gaps:
- Limited port infrastructure: Arkhangelsk, Murmansk, and Provideniya remain the primary Russian Arctic ports, with limited capacity for emergency response, ship repair, or cargo transshipment
- Icebreaker dependency: All commercial shipping requires Russian nuclear and conventional icebreaker escort (Rosatomflot), creating operational bottleneck and cost premium
- Medical and rescue limitations: Arctic emergency response capabilities remain rudimentary, with limited hospital and rescue infrastructure across the 2,000+ nautical mile route
- Environmental response capacity: Oil spill response and environmental remediation infrastructure are insufficient for the scale of potential Arctic maritime disasters
These constraints mean the NSR functions as a seasonal corridor for current operations (July–November peak, with extended shoulder seasons possible), limiting its utility as a year-round alternative to established routes. However, technological advances (Arc7 ice-class container vessels, improved icebreaker operations, port expansion) and continued ice melt are progressively extending navigable windows.
3.2 Great Power Competition in Arctic Regions: Russia, China, and NATO
The Arctic Sea Route emergence has catalyzed intense geopolitical competition among great powers seeking to establish control, secure resources, and shape Arctic governance. This competition occurs along three primary vectors: military positioning, infrastructure dominance, and regulatory authority.
Russia’s Arctic Dominance Strategy
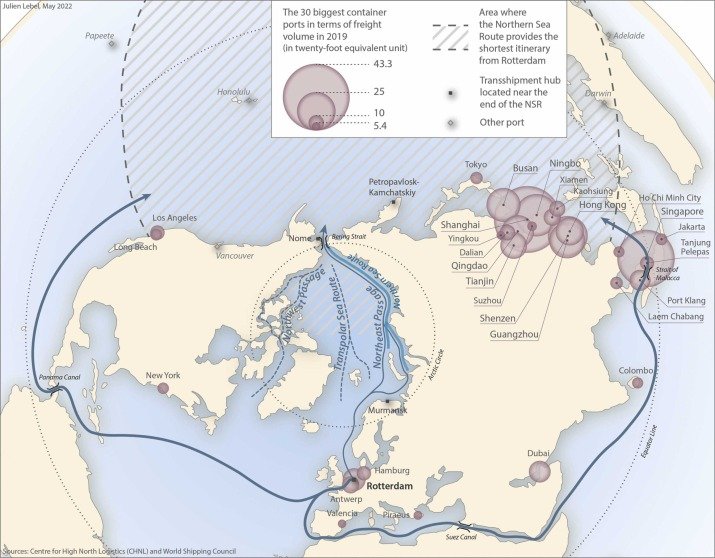
Russia views the Arctic as central to its identity, national security, and long-term development strategy. For Moscow, the NSR represents both an economic opportunity (reducing transport costs for resource exports) and a strategic asset (assertion of polar dominance and sphere-of-influence over Arctic waters).
Military and Infrastructure Investment:
- Icebreaker fleet dominance: Russia possesses more icebreakers than NATO combined, including nuclear-powered vessels capable of year-round operations—a strategic asymmetry that renders Russia the dominant Arctic actor despite NATO’s overall military superiority
- Military base modernization: Russia has invested heavily in Arctic military infrastructure stretching from the Kola Peninsula to the Bering Strait, creating an “integrated arc of control” with air defense, naval operations, missile forces, and surveillance systems supporting submarine operations (ballistic missile submarines, attack submarines, and guided-missile submarines)
- Submarine bastion strategy: Russia’s Arctic strategy emphasizes the use of heavily defended maritime zones where ballistic missile submarines can operate safely, protected by layered air defenses, surface ships, icebreakers, and coastal missile systems
- Northern Fleet modernization: Continuous investment in Arctic-capable surface ships, submarines, and coastal defense systems positions the Northern Fleet as a peer competitor to NATO forces in the region
Economic Development and NSR Dominance:
- LNG and hydrocarbon exports: Russia’s Arctic strategy emphasizes development of hydrocarbon resources (estimated at 13% of world’s undiscovered oil and 30% of natural gas) and export via the NSR
- Arctic LNG projects: Arctic LNG 2 project operates under Western sanctions using a “shadow fleet” of non-standard tankers and a single ice-class LNG carrier to maintain exports despite restrictions
- Infrastructure investment constraints: Russia has struggled to develop NSR infrastructure, with 2.2 million cubic meters of dredging in all Russian ports in 2025—a “marginal amount” insufficient to meet port development needs
- Chinese partnership dependency: Facing budget constraints and sanctions, Russia increasingly relies on China for Arctic port development and shipping services, creating a de facto Sino-Russian partnership in which China sets the terms of engagement
Russian Strategic Dilemma:
Russia’s Arctic dominance is increasingly constrained by economic weakness and sanctions-induced isolation:
- Sanctioned vessels: Over 65% of Russian crude oil shipments from Far Eastern Arctic ports utilize sanctioned tankers to bypass U.S. sanctions, indicating the shadow fleet is the primary mechanism for NSR exports
- Infrastructure bottleneck: Russia lacks the capital and technical expertise to develop NSR ports and supporting infrastructure to the scale required for substantial commercial traffic, forcing reliance on Chinese investment
- Crew scarcity: Russian law requires Arctic vessel officers to be Russian citizens with Arctic experience and LNG knowledge, but Russia faces an acute shortage of qualified Arctic mariners. This structural constraint limits Russia’s ability to impose exclusive control over Arctic operations
- Chinese leverage: As Russia’s primary source of investment and technology for Arctic development, China has emerged as Moscow’s “indispensable partner,” a reality that generates “deep unease” within the Kremlin regarding long-term Arctic control
China’s Arctic Expansion and “Polar Silk Road”
China’s Arctic strategy emphasizes commercial access to shorter shipping routes while positioning itself as a major investor in Arctic infrastructure and resources. Rather than confronting Russia militarily, China is pursuing economic integration and infrastructure dominance.
Commercial Shipping Expansion:
- Rapid container service growth: From 7 NSR container voyages (2023) → 11 (2024) → 14 (2025), with plans to scale further
- NewNew Shipping Arctic Express N1 service: Operational Shanghai/Ningbo–Arkhangelsk corridor with 13 voyages in 2024 and expanded 2025 operations
- Containerized cargo growth: From ~150,000 tons (2024) to 400,000 tons (2025), demonstrating rapid scaling of container traffic
- Arctic logistics investments: $2.5 billion investment in Arkhangelsk port expansion and agreements to develop logistics complexes in Provideniya Bay (Chukotka) and ice-free ports in Murmansk
- Goal trajectory: Russian projections suggest Chinese transit via NSR could reach 50 million tons annually by 2030
Infrastructure and Technology Integration:
- Port development partnerships: Joint Sino-Russian committees established to develop NSR infrastructure, with China pledging substantial investment in Russian Arctic ports
- Arc7 ice-class vessel orders: NewNew Shipping has announced orders for ice-capable container ships in partnership with Russia’s Rosatom nuclear agency, enabling year-round operations
- State-backed support: Unlike Western commercial operators, Chinese companies receive direct state support through policy lending, reduced icebreaker fees, and infrastructure investment, creating structural advantages
Broader Arctic Strategic Integration:
- Sino-Russian Arctic partnership: China and Russia have framed Arctic cooperation as part of broader Sino-Russian alignment, with Xi Jinping and Putin repeatedly emphasizing the NSR as a key corridor for “practical, year-round shipping”
- “Polar Silk Road” branding: Arctic development is presented as part of China’s Belt and Road Initiative, positioning Arctic shipping as infrastructure for reshaping Eurasian trade patterns
- Resource integration: Chinese investment in Russian Arctic LNG and hydrocarbon projects creates energy security dependencies and reinforces long-term Sino-Russian economic integration
Strategic Ambiguity:
China’s Arctic strategy is characterized by pragmatic cooperation rather than strategic confrontation with Russia. China benefits from:
- Access to shortest shipping routes between East Asia and Europe
- Long-term energy supplies from Russian Arctic hydrocarbon development
- Infrastructure investment opportunities in underdeveloped Russian Arctic regions
- Positioning as a major Arctic stakeholder without direct military confrontation with Russia or NATO
However, China’s economic dominance creates a structural reality: Russia maintains formal control of the NSR, but China increasingly determines its operational parameters. This asymmetry explains Russia’s strategic anxiety about Arctic development despite its military dominance.
NATO and Western Arctic Strategy
NATO’s Arctic strategy, articulated through the 2025 U.S. National Security Strategy and NATO Arctic doctrine, emphasizes:
Strategic Objectives:
- Deny non-Western dominance: Prevent Russia and China from establishing exclusive control over Arctic resources and shipping routes
- Greenland as strategic hinge: Position Greenland as critical to transatlantic security, Arctic surveillance, and control of the GIUK Gap (strategic chokepoint between Greenland, Iceland, and UK) through which Russian submarines transit
- Icebreaker capability expansion: Recognize Russia’s icebreaker fleet superiority as strategic liability for NATO and commit to expanding Western polar-capable vessels
- Military presence modernization: Deploy forces and establish “strategic anchors” (military bases and facilities) across Arctic regions, particularly in Greenland, Iceland, and Norway
Current Capability Gaps:
- Icebreaker disparity: NATO possesses approximately 12–15 operational icebreakers, while Russia maintains 40+ including nuclear-powered vessels, creating a 3:1 advantage for Russia in mobility and year-round Arctic operations
- Infrastructure limitations: Western Arctic port infrastructure remains limited, requiring development of emergency response, repair, and supply facilities to support expanded operations
- Coordination challenges: NATO Arctic operations involve multiple national fleets (U.S., Canada, Finland, Sweden, Norway) without integrated command-and-control, creating operational inefficiencies compared to Russia’s unified Northern Fleet
Greenland as NATO’s Arctic Lynchpin:
Greenland has acquired extraordinary strategic importance in NATO and U.S. Arctic thinking due to its position astride critical transatlantic shipping lanes and its proximity to Russian Arctic operations:
- GIUK Gap strategic role: Russian submarines transiting from Arctic bastions (Kola Peninsula, Barents Sea) must pass through the GIUK Gap to reach Atlantic operational areas. Greenland’s position provides NATO with strategic surveillance and anti-submarine warfare advantages
- Trans-Arctic chokepoint: As Arctic shipping increases, Greenland and Iceland acquire importance as gateways to new commercial corridors
- U.S. policy escalation: Trump administration 2025–2026 rhetoric (including hypothetical annexation proposals) reflects U.S. assessment of Greenland’s critical strategic value for Arctic dominance
- NATO response: European NATO members have deployed forces under Operation Arctic Endurance to assert collective NATO interest in Greenland, signaling that Arctic strategy cannot be pursued unilaterally
Inter-Arctic Power Dynamics and Escalation Risks
The Arctic is transitioning toward a highly militarized maritime space despite historical Cold War-era cooperative frameworks (Arctic Council, Ilulissat Declaration):
- Russian submarine activity: Intensifying Russian submarine operations in Arctic waters, particularly ballistic missile submarine patrols from Arctic bastions, create persistent security concerns for NATO
- NATO military expansion: NATO expansion into Arctic regions and deployment of advanced capabilities (air defense systems, missile forces, surveillance networks) represents escalatory response to Russian Arctic militarization
- Chinese military implications: While China’s Arctic strategy is primarily commercial, Chinese military observers have noted Arctic importance for projecting power in the North Atlantic and constraining NATO freedom of movement
- Potential conflict scenarios: Pentagon analysis explicitly identifies Russo-Chinese military cooperation in Arctic regions as potential trigger for NATO–Russia conflict, with particular concern about joint exercises and coordinated operations
3.3 Antarctic and Southern Ocean Routes: Future Viability and Governance
While Arctic routes are rapidly becoming viable, Antarctic routes remain largely theoretical due to extreme conditions, limited infrastructure, and environmental governance constraints. However, climate change is progressively increasing the viability of Southern Ocean passages, introducing both opportunities and profound environmental risks.
Current Status and Projected Viability
Antarctic shipping is not operationally viable for commercial trade as of January 2026, but climate modeling suggests multi-decadal trajectories toward increased accessibility:
Climate Projections:
- Long-term ice loss: Arctic ice models project that by 2100, the Antarctic/Southern Ocean will support year-round navigation for all major vessel types under high-emission scenarios, with Antarctic routes potentially handling 2.25% of global traffic (569,214 annual voyages) by century’s end
- Intermediate timescales (2050–2070): Modeling indicates 3–5 months of reliable open-water navigation in Antarctic waters by mid-century, with further extension by late century
- Seasonal windows: Current Antarctic navigation is limited to December–February (austral summer), with ice conditions restricting transit to ice-strengthened vessels even during optimal periods
Competitive Viability Against Traditional Routes:
Antarctic routes offer theoretical advantages for specific trade patterns, particularly Asia–Australia–South America and Asia–South Africa–Atlantic trade:
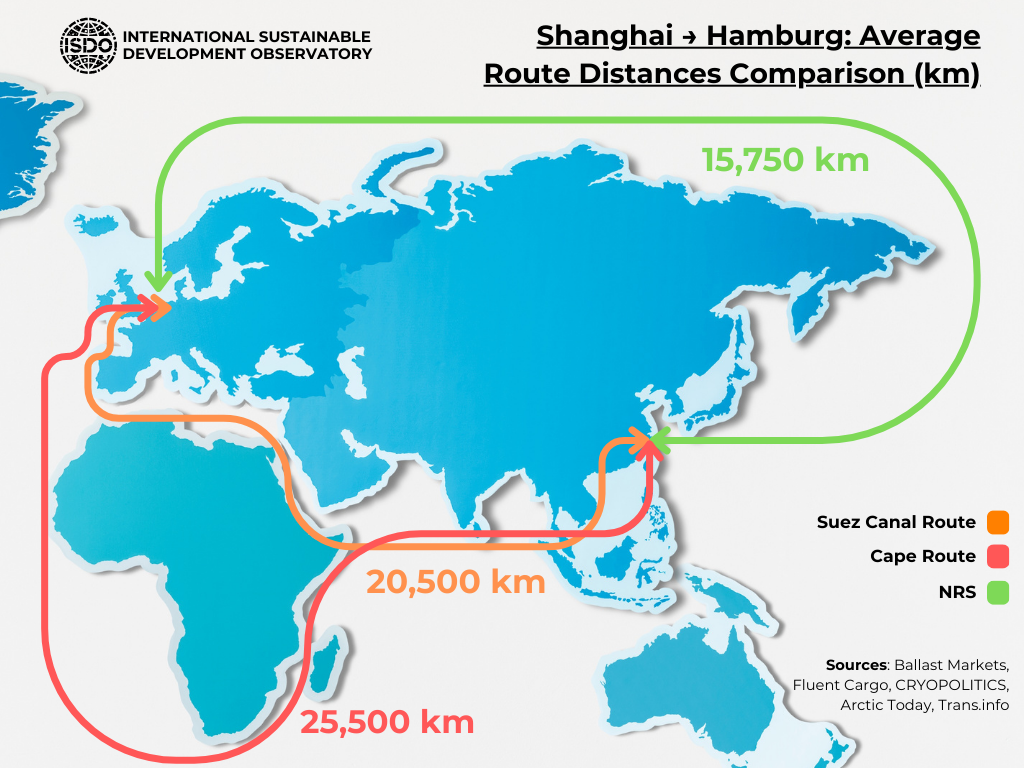
- Distance advantage: Routing around Antarctica rather than around South Africa or through Suez could reduce distances for some Australia-Europe trades by 15–25%, depending on specific origin and destination ports
- Economic viability threshold: Antarctic routing becomes economically competitive when combined with substantial ice melt reducing transit times and icebreaker escort requirements, likely not until 2050–2070
- Limited current utility: Given current extreme conditions, routing around Africa and via traditional Suez/Cape routes remains orders of magnitude more economically viable than Antarctic passages
Environmental and Governance Framework
The Antarctic region operates under the Antarctic Treaty System (ATS), a unique international governance framework established in 1961 that designates Antarctica as a region dedicated to peace, science, and environmental protection. This framework profoundly shapes the potential future of Antarctic shipping.
Antarctic Treaty System Structure:
- Basic principles: ATS designates Antarctica as a region reserved for peaceful purposes, with military activities (except scientific research) prohibited
- Environmental protocol: The 1991 Protocol on Environmental Protection (Madrid Protocol) designates Antarctica as a “natural reserve, devoted to peace and science”, establishing strict environmental protections and waste management requirements
- Shipping oversight: The International Maritime Organization (IMO) implements the Polar Code, which establishes mandatory safety and pollution-prevention measures for vessels operating in polar waters
Current Regulatory Gaps and Enforcement Challenges:
Despite comprehensive frameworks, significant enforcement and regulatory gaps exist:
- Non-SOLAS vessel regulation: Mandatory safety measures under the Polar Code apply only to vessels over 500 gross tons on international voyages. Fishing vessels, pleasure yachts, and small cargo ships remain inadequately regulated
- Gray water and sewage standards: Under current Polar Code provisions, raw sewage can be dumped anywhere beyond 12 nautical miles from land, ice shelves, or fast ice, creating risks in sensitive marine habitats
- Underwater noise regulation: Shipping noise affecting marine mammals remains largely unregulated, with only voluntary guidelines established by 2021
- Black carbon and emissions: While a 2011 ban on heavy fuel oil in Antarctic waters has reduced black carbon deposition, elevated concentrations of black carbon remain in snow around Antarctic research stations and tourism sites
- Ballast water management: Mandatory international standards on ballast water came into force in September 2024, phasing in requirements to reduce invasive species introduction over an eight-year period
Enforcement Capacity:
A critical governance challenge is enforcement capacity in Antarctic waters:
- Limited domain awareness: Antarctic nations and the Antarctic Treaty Secretariat have limited surveillance and monitoring capacity to detect and enforce compliance across the vast Southern Ocean
- Flag state responsibility: Enforcement relies primarily on flag state oversight, creating accountability gaps for vessels operating under flags of convenience
- International cooperation: Effective Antarctic governance requires sustained cooperation among Antarctic Treaty parties, but geopolitical tensions (particularly involving China’s expanded Antarctic presence) are straining consensus-based decision-making
Environmental Risks and Conservation Concerns
Antarctic shipping expansion introduces profound environmental risks in one of Earth’s most pristine marine ecosystems:
Biodiversity and Ecosystem Impacts:
- Keystone species vulnerability: Antarctic ecosystems depend on ice-dependent species (polar bears, seals, penguins, krill) that are vulnerable to ship strikes, noise pollution, and habitat disruption
- Krill depletion concerns: Antarctic krill (Euphausia superba) is a critical foundation species supporting whale, seal, and penguin populations. Increased shipping and associated fishing expansion could compound krill exploitation pressures
- Ocean acidification: Antarctic waters are particularly vulnerable to ocean acidification, which threatens shell-forming organisms (pteropods, mollusks) and disrupts marine food webs
Pollution and Accident Risks:
- Oil spill vulnerability: Antarctic waters lack adequate oil spill response infrastructure. A major tanker casualty in Antarctic waters would be catastrophic given limited remediation capacity and pristine conditions
- Invasive species introduction: Increased shipping creates pathways for invasive species introduction through ballast water and biofouling, potentially disrupting Antarctic ecosystems adapted to extreme isolation
- Microplastic pollution: Emerging evidence indicates elevated microplastic concentrations in Antarctic ice and water, with shipping contributing through gray water discharge and hull degradation
Governance Solutions Under Development:
International bodies are advancing protective measures:
- Particularly Sensitive Sea Areas (PSSAs): The IMO is considering PSSA designation for the Central Arctic Ocean and potentially Antarctic regions, which would restrict vessel activity and reduce accident risks
- Ecologically or Biologically Significant Areas (EBSAs): Scientific identification of critical ecosystems to inform marine protection area designation under the new Biodiversity Beyond National Jurisdiction (BBNJ) Agreement
- Marine Protected Areas (MPAs): Expansion of MPAs under the Antarctic Treaty system, with designation discussions ongoing for the East Antarctic and Weddell Sea regions
- Phase 2 Polar Code Development: Advocacy for mandatory rather than voluntary safety and environmental standards for non-SOLAS vessels, fishing vessels, and pleasure yachts operating in Antarctic waters
3.4 Interconnections Across Polar, Red Sea, and Traditional Routes: Integrated Global Maritime Architecture
The emergence of viable Arctic routes and future Antarctic corridors must be analyzed within the integrated context of a global maritime network experiencing fundamental restructuring. The Red Sea disruption, Cape diversion, Arctic opening, and potential Antarctic viability together constitute a reconfiguration of global shipping architecture driven by geopolitical, climate, and economic dynamics.
Route Competition and Portfolio Optimization
Shipping operators are developing multi-route portfolio strategies that treat Arctic, Red Sea/Suez, and Cape of Good Hope routing as competing alternatives within integrated networks:
Portfolio Routing Logic:
- Seasonal optimization: Arctic routes (viable July–November) are overlaid with Suez-dependent routes (year-round but geopolitically volatile) and Cape-dependent routes (year-round but operationally long), with carriers shifting traffic seasonally to optimize cost and reliability
- Vessel class matching: Ice-capable (Arc7) vessels enable Arctic operations but at higher capital cost. Carriers maintain fleets of standard open-water vessels for Suez/Cape routing and ice-capable vessels for Arctic seasonal use
- Risk segmentation: Different trade lanes utilize different routes based on shipper risk tolerance, cargo sensitivity, and cost pressures—high-value time-sensitive cargo tolerates Cape route’s extended transit; bulk commodities increasingly favor Arctic routing when available
- Infrastructure interdependence: Arctic port development (Arkhangelsk, Murmansk, Provideniya) creates feeder traffic through traditional hubs (Singapore, Rotterdam, Shanghai), linking Arctic corridors to established supply chain networks
Geopolitical Fragmentation and Strategic Route Control
The proliferation of route alternatives risks creating geopolitically fragmented maritime architecture where different routes serve different strategic blocs:
Emerging Route Alignments:
- Western-aligned routes: Suez Canal (Egyptian-controlled, U.S./NATO-aligned) and Cape of Good Hope (South African-controlled, increasingly pro-Western) serve Western/Allied operators
- Sino-Russian routes: Northern Sea Route (Russian-controlled, Chinese-invested) increasingly serves Sino-Russian bilateral trade and non-Western actors
- Regional routes: Emerging West African transhipment hubs and Indian Ocean corridors serve regional trade but remain vulnerable to great-power intervention
- Contested corridors: South China Sea, Straits of Malacca remain vulnerability zones where trade is exposed to geopolitical disruption
This fragmentation means global supply chain resilience has become geopolitically determined: shippers cannot freely choose optimal routes but must select corridors aligned with geopolitical positioning and sanctions exposure.
Emissions and Climate Implications of Route Proliferation
The diversification of shipping routes introduces contradictory sustainability outcomes:
Positive Outcomes (Arctic Routing):
- Fuel efficiency: NSR routing reduces fuel consumption by 50–70% during favorable seasons compared to Suez routes, translating to 80–90% emissions reductions
- Carbon advantage trajectory: If Arctic routes achieve year-round viability, aggregate global maritime emissions could decline substantially through route shortening and efficiency gains
Negative Outcomes (Cape Routing and Network Lengthening):
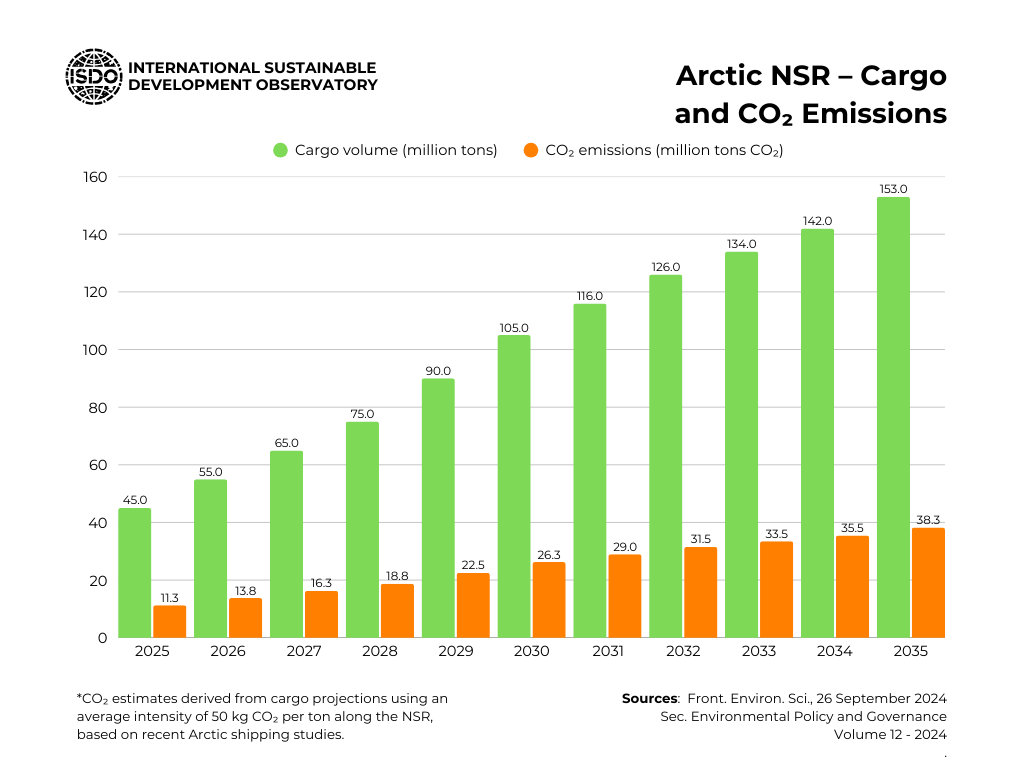
- Ton-miles increase: Cape routing and extended supply chains increased ton-miles by 6% in 2024 while trade volume grew only 2.2%, indicating supply chain lengthening offset efficiency gains
- Aggregate emissions increase: Extended Cape routes and expanded Arctic/Antarctic shipping in extreme-environment operations produce net emissions increases despite per-voyage fuel efficiency improvements
- Vulnerable ecosystem transit: Arctic shipping in polar regions produces elevated black carbon deposition and underwater noise pollution affecting pristine ecosystems
Research Projections:
Nature research indicates that by 2050, Arctic shipping expansion (even under climate mitigation scenarios) will increase aggregate maritime carbon emissions by 0.5–1.2% annually due to:
- Traffic increase: Greater absolute traffic volume through Arctic routes
- Extreme environment operations: Higher fuel consumption for ice navigation and harsh weather conditions
- Non-optimized supply chains: Route proliferation creates inefficiencies as shipments are rerouted through multiple Arctic, Pacific, and Atlantic corridors rather than following optimized paths
Implications for Sustainable Development and Development Equity
The restructuring of global maritime networks has profound implications for development equity and vulnerability:
Winners from Route Restructuring:
- Arctic-adjacent economies: Russia, China, Nordic countries benefit from Arctic route development, infrastructure investment, and resource access
- Technology leaders: Shipping companies and ports with advanced capabilities benefit from route complexity and specialized services
- Developed economies: Western economies with advanced supply chain management absorb Cape routing costs; developing economies cannot
Losers from Restructuring:
- Small island developing states (SIDS): Dependent on maritime trade for imports of food, fuel, and manufactured goods; elevated freight costs and route disruption disproportionately affect food security and energy access
- Least developed countries (LDCs): Extended lead times, elevated transportation costs, and exposure to geopolitical route control undermine manufacturing competitiveness and development trajectories
- Suez-dependent economies: Egypt faces sustained fiscal losses from reduced canal transit; other Suez-corridor economies (Djibouti, Oman, Sudan) experience trade volatility
- Climate-vulnerable Arctic communities: Indigenous Arctic communities and small Arctic nations (Greenland, Iceland) face environmental disruption from shipping expansion despite lacking control over route decisions
Section 4: Maritime Geopolitics and the International Order
4.1 From Open Seas to Contested Corridors: The Erosion of Neutral Maritime Frameworks
The Red Sea crisis, combined with broader geopolitical fragmentation and chokepoint vulnerabilities, represents a fundamental erosion of the post-World War II maritime order: the principle that international seas constitute neutral terrain governed by universal law of the sea doctrines and open to all vessels regardless of flag or ownership. This erosion has been gradual, punctuated by recurring disruptions (2021 Suez blockade, Panama Canal drought, South China Sea tensions), but the Red Sea crisis has crystallized a stark reality: maritime chokepoints are no longer reliably neutral corridors but contested geopolitical zones vulnerable to disruption by state and non-state actors pursuing strategic objectives.
The Legal Foundation: UNCLOS and Freedom of Navigation
The international maritime framework centers on the United Nations Convention on the Law of the Sea (UNCLOS), adopted in 1982 and effective from 1994. UNCLOS established a comprehensive legal regime governing maritime activities, establishing several foundational principles:
Territorial Waters and Exclusive Economic Zones (EEZ):
UNCLOS designated maritime space into functional zones with differentiated governance:
- Territorial Sea (0–12 nautical miles): Coastal states exercise full sovereignty, including the right to regulate navigation and enforce laws. Vessels enjoy the right of “innocent passage”—transit through territorial seas without engaging in threatening conduct.
- Exclusive Economic Zone (EEZ, 12–200 nautical miles): Coastal states possess sovereign rights over natural resources and specified jurisdiction, but freedom of navigation and overflight remain guaranteed for all states. The EEZ represents a “sui generis” legal regime balancing coastal state interests with high-seas freedoms.
- High Seas (beyond 200 nautical miles): Open to all states with rights including freedom of navigation, overflight, and fishing. No state may claim sovereignty over high seas areas.
Freedom of Navigation Through Strategic Straits:
A critical UNCLOS provision addresses passages through straits used for international navigation. Article 34–45 establish the concept of “transit passage”: vessels of all states enjoy the right to transit straits used for international navigation (such as the Strait of Malacca, Strait of Hormuz, Bab el-Mandeb, and Turkish Straits) without coastal state interference, provided they comply with international safety and environmental standards.
The intent was to prevent coastal states from instrumentalizing geographic chokepoints to deny maritime access. By codifying transit passage, UNCLOS aimed to protect neutral passage through strategically critical straits from state-level coercion.
Reality Gap: Chokepoint Contestation and Disruption
Despite UNCLOS’s comprehensive legal framework, actual maritime practice has diverged substantially from treaty provisions, particularly regarding chokepoint security and transit reliability:
The Red Sea Crisis as Legal and Institutional Breakdown:
The Houthi attacks on commercial shipping violated multiple UNCLOS provisions and international maritime law principles:
- Violation of freedom of navigation: The attacks targeted merchant vessels exercising their right to transit the Bab el-Mandeb Strait and Red Sea, fundamentally interfering with transit passage rights.
- Violation of flag state immunity: Commercial shipping is protected under international maritime law. Houthi targeting of merchant vessels regardless of flag, cargo destination, or owner created indiscriminate interference with maritime commerce.
- Use of maritime space for armed confrontation: The attacks militarized a supposedly neutral commercial corridor, contradicting the principle that maritime space should be reserved for peaceful uses.
However, international law enforcement mechanisms proved inadequate to prevent or deter these violations.UNCLOS dispute settlement mechanisms are designed for state-to-state disputes (through arbitration, International Court of Justice, International Tribunal for the Law of the Sea). They are ill-suited for addressing non-state actor interference with commerce.
Enforcement Capacity Gap:
Response to the Red Sea crisis revealed that maritime law enforcement depends ultimately on military capacity and political will rather than formal legal frameworks:
- U.S.-led coalition response: Rather than invoking UNCLOS mechanisms, Western nations responded with military intervention—airstrikes on Houthi launch sites, naval escort operations, and direct military deterrence.
- Egyptian Canal Authority reliance on military security: Egypt’s Suez Canal Authority cannot enforce UNCLOS transit passage rights independently; security depends on Egyptian military capacity and international naval support.
- Insurance market adaptation: Rather than legal enforcement, the maritime system adapted through war risk insurance repricing, effectively rationing access to Red Sea routes through economic mechanisms rather than law.
This adaptation reveals that formal international law has become secondary to market-based risk allocation and military capacity in determining actual maritime access.
Geopolitical Realignment: From Universal Principles to Aligned Corridors
The contemporary maritime system exhibits increasing alignment with geopolitical blocs:
Western-Aligned Corridors:
- Suez Canal (Egyptian control, U.S.-allied security architecture)
- Cape of Good Hope (South African control, increasingly pro-Western alignment)
- Mediterranean hubs (European port control)
- Panama Canal (U.S.-influenced governance, though sovereignty resides with Panama)
Sino-Russian Corridors:
- Northern Sea Route (Russian control, Chinese investment)
- South China Sea passages (disputed, Chinese assertiveness)
- Proposed Northern Corridor initiatives
Regional and Contested Corridors:
- Strait of Hormuz (Iranian proximity, contested control)
- Bab el-Mandeb (Yemeni/Saudi/UAE contested zone)
- Malacca Strait (Indonesian control, multiple power interests)
Operational Reality:
Increasingly, shipping routing reflects geopolitical alignment rather than economic optimization. Risk-averse Western operators accept Cape routing (longer, more expensive) to avoid Suez geopolitical exposure. Chinese operators gain preferential access to Northern Sea Route through state-backed investment in Russian Arctic infrastructure. This represents a fragmentation of global maritime networks along geopolitical lines, contrary to the universal-access principle underlying UNCLOS.
4.2 Concentration Risk in Remaining Chokepoints: The Systemic Vulnerability
Despite route diversification efforts (Arctic opening, West African transhipment, Indian Ocean expansion), global maritime commerce remains dependent on a limited number of critical chokepoints. Analysis of remaining chokepoints reveals extreme concentration risk where disruption to individual straits or canals can cascade through global supply chains.
The Critical Chokepoints and Their Systemic Importance
Bab el-Mandeb Strait: Control of Suez Access
- Geographic position: Narrows to 30 kilometers at its narrowest point, forming the only passage between the Red Sea and Gulf of Aden
- Traffic volume: Approximately 70 vessels per day transit during normal operations, handling approximately 12–15% of global maritime trade
- Commodity concentration: Container shipping (30% of containers), oil tankers, LNG carriers, bulk grain vessels
- Strategic vulnerability: Proximate to Yemen and Somalia, politically unstable regions with non-state actor presence (Houthis, Somali pirates)
- Disruption cascade: Closure or significant congestion propagates through Suez Canal, Mediterranean, and global container networks within 1–2 weeks
Suez Canal: Asia–Europe Linchpin
- Geographic position: Connects Mediterranean and Red Sea through 193 kilometer artificial channel; solely controlled by Egypt
- Strategic importance: Shortest shipping route between Asia and Europe; handles approximately 12% of global trade, 30% of global container traffic
- Chokepoint characteristics: Single-channel system (except for recent expansion) vulnerable to blockage by single grounded vessel; 2021 blockade (Ever Given incident) demonstrated this risk
- Institutional vulnerability: Egyptian management faces fiscal pressures (45.5% revenue decline 2024–2025 due to Red Sea disruption); infrastructure limitations create bottleneck susceptibility
- Geopolitical leverage: Egypt’s strategic importance gives it disproportionate leverage in regional conflicts
Strait of Hormuz: Energy Chokepoint
- Oil/LNG concentration: Approximately 20% of world’s oil transits the Strait, plus significant LNG flows to Europe and Asia
- Width constraint: Narrowest point 54 kilometers wide; Iran controls eastern channel, Oman western channel
- Iranian proximity: Iran borders the strait; historical Iranian threats to close the strait or interfere with shipping create persistent risk
- Cascading energy impacts: Disruption directly impacts oil prices, energy security, and geopolitical stability globally
Panama Canal: East–West Linchpin
- Traffic concentration: Handles approximately 5% of global maritime trade, 15% of containerized trade; vital for Asia–U.S. East Coast routing
- Recent vulnerability: 2023–2024 drought caused operational restrictions, reducing daily transits from 38 to 25, demonstrating climate-induced disruption risk
- Infrastructure limitation: Single set of locks; vessel queue creates bottleneck; modernization ongoing but capacity remains constrained
- Geopolitical tensions: U.S.–Panama tensions over U.S. military presence and canal governance create institutional friction
South China Sea Passages:
- Choke point concentration: Multiple strategic passages—Malacca Strait (75,000 vessels/year), Sunda Strait, Lombok Strait—concentrate routing
- Dispute jurisdictions: Contested maritime claims (China’s nine-dash line, Filipino claims, Vietnamese claims, Malaysian claims) create legal ambiguity
- Military congestion: U.S. freedom of navigation operations, Chinese military exercises, and other military activity converge on commercial shipping lanes
- Disruption risk: Militarized confrontation (Taiwan Strait, South China Sea) could disrupt critical Asia–Europe and Asia–Americas routing
Quantifying Chokepoint Disruption Risk
The concentration of global maritime trade through these chokepoints creates systemic vulnerability where disruption to single points cascades globally:
Scenario: Bab el-Mandeb Closure or Extended Disruption
- Immediate impact (Week 1): 70 vessels/day divert to Cape route; Suez Canal traffic diverts to backup routes
- Global container shipping impact: 30% of global container capacity redirected; freight rates triple within 48–72 hours
- Economic impact (4-week projection): $15–20 billion supply chain cost increase; 0.3–0.5 percentage point global inflation contribution
- Developing country impact: SIDS face 0.9% consumer price increase; LDCs experience 1–2% inflation spike; food security threatened
Scenario: Suez Canal Blockage (Extended, >30 days)
- Immediate impact: 12% global trade diverted; Cape routing becomes dominant; estimated $50–100 billion economic costs
- Energy markets: Oil prices spike $10–15 per barrel; LNG diversion creates European energy security crisis
- Port congestion: Singapore, Rotterdam, other key hubs experience queue lengths exceeding 14 days; demurrage/detention costs accumulate
- Manufacturing: Just-in-time supply chains break; factory shutdowns cascade across automotive, electronics, machinery sectors
Scenario: Strait of Hormuz Disruption
- Oil market impact: 20% of world oil supply disrupted; Brent crude spike to $150–200+ per barrel (compared to baseline $70–90)
- Global recession risk: Oil price spike sufficient to trigger demand destruction and recession in developed economies
- Developing country vulnerability: Oil-importing LDCs and SIDS face existential energy security crisis
Systemic Architecture: Why Chokepoint Redundancy Is Limited
Despite efforts to develop alternative routes (Arctic, West Africa, extended Indian Ocean), structural features prevent true chokepoint redundancy:
Geographic Determinism:
Multiple chokepoints exist because geography dictates traffic patterns. There is no viable alternative to Suez Canal for rapid Asia–Europe transit; no alternative to Strait of Hormuz for Persian Gulf oil exports; no alternative to Bab el-Mandeb for Red Sea passage. Redundancy requires distance; distance requires cost. Economic optimization pulls shipping toward single chokepoints.
Infrastructure Lock-In:
Transshipment hub infrastructure, port terminal capacity, and inland distribution networks are optimized around specific chokepoint routes. Developing alternative hubs requires 5–15 year infrastructure investment. During acute crisis, infrastructure capacity cannot be rapidly deployed elsewhere.
Geopolitical Control Concentration:
Most critical chokepoints are controlled by single states or small groups of states:
- Suez Canal: Egypt alone
- Panama Canal: Panama (U.S.-influenced)
- Malacca Strait: Indonesia, Malaysia, Singapore
- Strait of Hormuz: Iran and Oman
Single-state control creates strategic leverage: these states can impose tariffs (Suez Canal fees), restrict access (Iran’s threatened Hormuz closure), or negotiate conditions. No global governance mechanism constrains this leverage except military power of interested parties.
4.3 Fragmentation of Global Maritime Governance: Institutional Gaps and Erosion
The maritime crisis has revealed profound fragmentation in global maritime governance institutions, with multiple overlapping but incomplete regulatory mechanisms failing to provide coherent governance:
Institutional Landscape: Overlapping Authority and Gaps
UNCLOS and ITLOS (International Tribunal for the Law of the Sea):
- Design purpose: State-to-state dispute resolution
- Adequacy gap: Cannot address non-state actor disruption, private shipping company routing decisions, or insurance market dynamics
- Enforcement mechanism: Relies on voluntary state compliance and secondary sanctions; lacks independent enforcement capacity
- Notable limitation: U.S. not a signatory (Senate ratification blocked since 1982); undermines institutional legitimacy and enforcement authority
IMO (International Maritime Organization):
- Regulatory scope: Shipping safety, pollution prevention, maritime security
- Adequacy gaps: War risk insurance, port security, geopolitical coordination fall outside IMO mandate
- Enforcement mechanism: Flag state responsibility; many vessels operate under flags of convenience with weak regulatory oversight
- Coordination problem: IMO operates through consensus; geopolitical polarization has begun blocking consensus on Arctic, South China Sea, and Red Sea governance
Regional Maritime Organizations:
- Proliferation: Numerous regional bodies (Indian Ocean Rim Association, Association of Southeast Asian Nations, African Union, Caribbean Community, etc.) operate with limited coordination
- Adequacy: Lack capacity to enforce international standards, conduct maritime surveillance, or impose penalties on violators
- Fragmentation problem: Regional variation in regulations (piloting requirements, environmental standards, labor standards) creates compliance complexity and arbitrage opportunities
Private Governance: Insurance and Classification Societies:
- Actual function: War risk insurance repricing and port authority decisions effectively dictate shipping routes, not international law
- Institutional legitimacy: Insurance markets and classification societies operate for profit, not public interest
- Governance question: Should private financial actors determine maritime security architecture?
Governance Vacuum in Critical Areas
Non-State Actor Enforcement:
International maritime law and institutions have no mechanism for addressing non-state actor interference with commerce. UNCLOS and IMO assume state-level compliance. The Houthi disruption exploited this institutional gap: there is no legal framework for deterring, prosecuting, or sanctioning non-state actors interfering with shipping.
Chokepoint Transit Guarantees:
Despite UNCLOS’s freedom of navigation principle, there is no binding institutional guarantee that critical straits will remain open or that transit fees will remain reasonable. Egypt can unilaterally increase Suez Canal fees; Iran can threaten Hormuz closure; Indonesia can restrict Malacca Strait passage. No international mechanism constrains these sovereign decisions except great-power military intervention.
Geopolitical Alignment of Shipping Routes:
Institutions lack mechanisms to prevent the bifurcation of maritime networks along geopolitical lines. Western operators routing via Cape; Chinese operators routing via NSR; other operators forced to choose between geopolitical blocs. This fragmentation violates UNCLOS’s universal access principles but occurs outside formal institutional frameworks.
Environmental and Social Standards Enforcement:
While IMO and MARPOL (International Convention for the Prevention of Pollution from Ships) establish environmental standards, enforcement remains weak:
- Flag state responsibility means compliance depends on flag state capacity and willingness
- Flags of convenience (Panama, Marshall Islands, Liberia) register 67% of global merchant fleet with weak oversight
- Enforcement actions rare; penalties insufficient to deter violations
- Polar Code environmental standards for Arctic shipping lack robust enforcement mechanisms
Governance Reform Proposals and Implementation Barriers
International institutions have proposed governance reforms to address maritime security and chokepoint vulnerabilities:
Proposed Red Sea Security Architecture:
Multiple proposals suggest institutionalizing maritime security in the Red Sea through:
- Joint maritime protection and intelligence sharing among regional and extra-regional states
- Coordinated escort arrangements reducing unilateral state control
- Risk-sharing insurance mechanisms
- Diplomatic de-escalation frameworks
Implementation barriers:
- Divergent geopolitical interests: U.S., Israel, Saudi Arabia, and Iran have conflicting security objectives
- Regional state capacity limitations: Yemen, Sudan, Somalia lack governance capacity
- Non-state actor coordination: No mechanism for communicating with or conditioning Houthi behavior
- Great-power constraints: U.S.–China, U.S.–Russia tensions complicate security coordination
UNCLOS Modernization Proposals:
Experts propose updating UNCLOS provisions to address contemporary challenges (climate change, non-state actors, cyber threats, Arctic governance). However:
- Amendment difficulty: UNCLOS amendment requires super-majority support; geopolitical polarization has blocked consensus
- Non-signatory constraints: U.S., non-parties cannot be bound by amendments
- Institutional legitimacy: UNCLOS authority has eroded as compliance has declined; formal updates cannot restore compliance if underlying geopolitical interests diverge
4.4 Implications for Developing Countries and Small Island States: Systemic Disadvantage
The restructuring of global maritime governance and the emergence of contested chokepoints have profoundly asymmetric implications for different economies. Developing countries, particularly Small Island Developing States (SIDS) and Least Developed Countries (LDCs), face structural disadvantages that undermine development trajectories and economic security.
SIDS and LDCs: Structural Vulnerability to Maritime Disruption
Geographic and Economic Dependence on Shipping:
SIDS and LDCs are characterized by:
- Trade dependence: Typically 60–80% of external trade moves by sea; landlocked developing countries depend 100% on maritime access through neighboring countries’ ports
- Import concentration on essential goods: Food, fuel, and manufactured goods constitute 50–70% of imports; non-discretionary purchases vulnerable to price shocks
- Limited economic diversification: Tourism, agricultural exports, and resource-based sectors provide primary revenue; shipping disruptions directly impact these sectors
Food and Energy Security Vulnerability:
SIDS import 60–90% of food consumption; some nations (Dominica, Jamaica) allocate over 100% of export earningsto food imports—a figure reflecting the structural impossibility of self-sufficiency and the absolute dependence on maritime access.
- Rice imports: Approximately 20% of global rice exports flow through Red Sea; SIDS dependent on this corridor face food security crisis if disrupted
- Fuel imports: SIDS entirely dependent on imported fuel; shipping disruption directly creates energy crisis
Quantified Vulnerability Metrics:
- Maritime transport costs as percentage of GDP: SIDS face transport costs of 15–25% of import value; developed economies face 2–3%
- Inflation transmission: Maritime cost increases pass through 100% to retail prices within 6–12 months; SIDS face consumer price spikes of 0.9% per 1% freight cost increase (compared to 0.2% for developed economies)
- 2024–2025 impacts: SIDS consumer prices projected to increase 0.9% by 2025 due to Red Sea disruption; processed food costs increase 1.3%, directly threatening food security
Comparative Impact Analysis:
| Economy Type | Freight Cost as % of GDP | Inflation Elasticity to Shipping Costs | Food Import Dependence | Crisis Vulnerability Rating |
|---|---|---|---|---|
| SIDS | 15–25% | 0.9% | 60–90% | CRITICAL |
| LDCs | 12–18% | 0.7% | 40–60% | HIGH |
| Landlocked Dev. | 20–30% | 1.0% | 50–70% | CRITICAL |
| Developed Economies | 2–4% | 0.2% | 20–30% | LOW |
Source: UNCTAD 2024, IMF 2024, Forbes 2024
Fiscal and Debt Implications: The Debt-Sustainability Crisis
Many SIDS face acute fiscal vulnerability, with maritime disruption triggering debt crises:
Pre-Crisis Debt Levels:
- 70% of SIDS exceed debt sustainability thresholds (60% debt-to-GDP)
- 40% of SIDS near or facing debt distress (debt-to-GDP exceeding 80%)
- Debt servicing consumes 15–30% of government revenues in highly indebted SIDS
Crisis-Induced Debt Escalation:
When maritime disruption triggers inflation and economic contraction:
- Revenue decline: Tourism collapses; export prices weaken; tax revenues decline
- Cost escalation: Food and fuel import bills spike; debt service obligations escalate
- Fiscal squeeze: Governments face impossible choice between debt repayment and essential spending (health, education, food security programs)
- Development path disruption: Fiscal constraints eliminate investment in infrastructure, education, and climate adaptation
Precedent: Caribbean SIDS faced this dynamic in 2020–2021 during COVID-19 pandemic. Tourism collapsed; import prices spiked; multiple nations approached debt restructuring. Recovery remains incomplete as of January 2026.
Geopolitical Marginalization: Voice and Influence Deficit
SIDS and LDCs face systematic exclusion from maritime governance processes, despite being most vulnerable to disruption:
Participation Gaps:
- UNCLOS dispute settlement: Tribunal cases require substantial legal expertise and resources; SIDS and LDCs rarely initiate or participate in proceedings
- IMO decision-making: Voting power concentrated among major maritime states; SIDS and LDCs have minimal influence over regulatory frameworks
- Regional security arrangements: Red Sea security discussions involve U.S., Israel, Saudi Arabia, Iran, Egypt, but exclude Yemen (most affected), Djibouti (Port Authority), Somalia (nascent state)
- Insurance market governance: Private insurance firms determine risk pricing and coverage; SIDS and LDCs have no formal voice
Structural Exclusion:
The maritime system operates through institutional structures (UNCLOS, IMO, private insurance) designed by and for developed maritime states. SIDS and LDCs face a governance architecture not responsive to their vulnerabilitiesand lacking mechanisms for vulnerable populations to influence decisions affecting them.
Development Regression and SDG Impacts
Maritime disruption directly undermines sustainable development trajectories for vulnerable economies:
SDG 1 (No Poverty): Maritime disruptions increase food prices, unemployment, and poverty rates. For SIDS dependent on tourism and fishing, shipping disruption triggers economic contraction and poverty increase.
SDG 2 (Zero Hunger): Food import dependency coupled with maritime disruption creates acute food insecurity. Prices spike; purchasing power collapses; malnutrition increases, particularly for children.
SDG 3 (Good Health and Well-being): Pharmaceutical import disruptions directly threaten health security. Extended supply chains create medicine shortages; healthcare infrastructure degrades.
SDG 5 (Gender Equality): Economic crises disproportionately affect women through reduced employment, nutritional stress, and increased domestic burdens. School enrollment declines as families prioritize food security over education.
SDG 10 (Reduced Inequalities): Maritime disruption exacerbates global inequality. Developed economies absorb cost shocks; developing economies face disproportionate impacts. The fragmentation of shipping routes along geopolitical lines reinforces global bifurcation.
SDG 14 (Life Below Water): Extended shipping routes increase maritime emissions and pollution in vulnerable marine ecosystems (Indian Ocean, West African waters, Caribbean) where SIDS depend on fisheries.
5: Sustainability, Environmental Justice, and Development
5.1 Emissions Impacts of Rerouting and Route Fragmentation
The restructuring of global shipping networks around the Cape of Good Hope, rather than through the Suez Canal and Red Sea, has generated profound and counterintuitive environmental consequences that directly undermine climate goals and create a fundamental paradox: achieving greater shipping network resilience through geographic diversification has been accomplished at the cost of substantially increased global maritime emissions and extended supply chain environmental footprints.
Quantifying the Emissions Impact: The Red Sea Crisis as Carbon Shock
The magnitude of emissions increase from Red Sea rerouting is staggering and directly measurable through satellite and emissions data:
Containerized Shipping Emissions Spike:
- EU container shipping emissions 2024: 52.7 million tons CO₂, compared to projected baseline of 34.7 million tons if pre-2023 emission reduction trends had continued (−4.4% annual average 2018–2023)
- Additional emissions attributable to Red Sea crisis: 18 million tons of CO₂ in 2024 alone, equivalent to the entire annual carbon emissions of Cambodia
- Containerized shipping sector impact: 45% increase in CO₂ emissions from container shipping in 2024 due to Cape routing, despite total shipping seeing only 10% emissions increase
- Year-over-year container emissions: 14% increase in 2024 (reaching 240.6 million tons), surpassing the 2021 peak of 218.5 million tons prior to any pandemic recovery
Per-Voyage Emissions Calculations:
For individual Asia–Europe container routes, emissions increases are measurable and substantial:
- Shanghai to Rotterdam via Suez: 10,513 nautical miles, 0.86 tonnes CO₂e
- Shanghai to Rotterdam via Cape: 13,793 nautical miles, 1.13 tonnes CO₂e (38% increase)
- Per-voyage CO₂ increase: 0.27 tonnes CO₂e per container movement; scaled across 10,000+ weekly Asia–Europe container movements, this represents 140,000+ tons CO₂ weekly (7.3 million tons annually)
- Singapore to Rotterdam via Suez: 9,632 nautical miles, 0.7 tonnes CO₂e
- Singapore to Rotterdam via Cape: 13,574 nautical miles, 0.9 tonnes CO₂e (29% increase)
Satellite-Confirmed Emissions Shifts:
Satellite-based nitrogen dioxide (NO₂) observations from TROPOMI instrument directly confirm the rerouting and associated emissions changes:
- Red Sea NO₂ levels: Declined approximately 55% from January–June 2024 compared to 2023, reflecting sharp reduction in Red Sea traffic
- Cape of Good Hope NO₂ levels: Increased approximately 40% during same period, reflecting surge in traffic
- Gibraltar Strait NO₂ levels: Declined approximately 15%, indicating reduced Mediterranean transshipment flows
These satellite measurements directly correlate with vessel statistics, providing independent verification of routing shifts and their emissions consequences.
Emissions Trajectory and IMO Climate Target Misalignment
The Red Sea crisis has caused dramatic setback to global maritime decarbonization trajectories:
Pre-Crisis Decarbonization Trend (2018–2023):
Container vessels had consistently been reducing emissions despite increasing trade volumes:
- Annual emissions reduction rate (2018–2023): −4.4% average annual decline
- Decoupling achievement: Container shipping growing while emissions declining—a positive decarbonization signal
Post-Crisis Emissions Reversal (2024–2025):
The 18 million ton additional emissions in 2024 represent a single-year collapse of approximately 4 years of prior decarbonization progress.
IMO 2023 GHG Strategy Targets vs. Current Trajectory:
| Target | 2030 Objective | 2024 Performance vs. 2008 Baseline | Gap Assessment |
|---|---|---|---|
| Carbon intensity reduction | ≥40% reduction | ~5–8% reduction achieved | Gap: 32–35% |
| Zero/near-zero fuels | 5% (striving 10%) | <1% adoption | Gap: 4–9% |
| Total annual GHG emissions | ≥20% reduction (striving 30%) | +10% increase vs. 2008 | Gap: 30–40% |
Source: IMO 2023 GHG Strategy, DNV 2024 Assessment
The Red Sea crisis has created a structural setback in maritime decarbonization. Even assuming full Suez Canal recovery by 2026, the 2024 emissions spike requires extended recovery period before global shipping can resume pre-crisis decarbonization trajectories. Under current projections, shipping will miss 2030 carbon intensity targets by approximately 32–35 percentage points, requiring emergency acceleration of zero-carbon fuel adoption and operational changes to compensate.
Supply Chain Ton-Miles and Aggregate Efficiency Loss
A critical but less-publicized metric reveals the structural inefficiency of fragmented maritime networks: ton-miles(total distance traveled by cargo) increased substantially:
- 2024 ton-miles increase: Record 6% increase, nearly three times faster than trade volume growth (2.2%)
- Implication: Global supply chains lengthened fundamentally, with cargo traveling substantially farther on average
- Aggregate emissions impact: Ton-miles increase of 6% against volume growth of 2.2% indicates supply chain lengthening creating approximately 3–4 million additional tons CO₂ annually beyond direct route-specific calculations
This ton-miles metric demonstrates that even with modest trade growth, the fragmentation of maritime networks creates aggregate inefficiency that extends beyond Suez-to-Cape route differences. Alternative routing through West Africa, Indian Ocean ports, and other diversified corridors creates cumulative lengthening effects across global supply chains.
5.2 Environmental Risks in Polar and Southern Ocean Operations
As Arctic and Antarctic routes become increasingly viable due to climate change, they introduce new environmental risks concentrated in regions of extraordinary ecological sensitivity and limited governance capacity.
Arctic Shipping and Black Carbon Amplification
Arctic shipping produces distinctive environmental risks centered on black carbon emissions—short-lived climate forcers with dramatically amplified warming impacts in polar regions.
Black Carbon Mechanisms and Arctic Amplification:
When vessels burn heavy fuel oil (HFO), they emit black carbon particles that deposit on snow and ice surfaces. These particles:
- Reduce albedo (reflectivity): Black particles absorb solar radiation rather than reflecting it, causing surfaces to warm more rapidly
- Amplified Arctic warming: Black carbon deposits on Arctic ice and snow have 7–10 times greater warming impact than CO₂ on a 20-year timescale, due to albedo reduction
- Positive feedback acceleration: Warming from black carbon accelerates ice melt, reducing reflective ice surface area, further amplifying warming
Current Arctic Black Carbon Emissions Trends:
- Global shipping black carbon emissions: 85% increase between 2015 and 2019
- Arctic black carbon emissions from shipping: Rose 8% globally per decade, but 85% increase in Arctic between 2015 and 2019 alone—10 times faster than global rate
- Arctic shipping share: About 2% of global shipping’s black carbon comes from Arctic operations, but with 7–10 times greater warming impact, Arctic shipping contributes 14–20% of shipping-related Arctic warming on a 20-year basis
- Heavy fuel oil share: Approximately 75% of Arctic marine fuel is HFO, generating highest black carbon emission intensity
Future Trajectory (2024–2030):
With NSR operations expanding to 103 transits in 2025 and projected growth to 50+ million tons annually by 2030:
- Black carbon emission growth: Current growth trajectory suggests 20–25% increase in Arctic black carbon from shipping between 2025 and 2030
- IMO HFO ban limitations: The IMO’s heavy fuel oil ban in Arctic waters (effective 2024–2029) will reduce black carbon emissions by only 5%, as alternative fuels produce comparable black carbon concentrations
- Loophole timeline: Full closure of HFO regulations not until mid-2029; interim period likely sees continued growth in black carbon emissions during phase-out
Environmental Consequences:
The combination of expanded Arctic shipping and persistent black carbon emissions creates a vicious feedback loop:
- Increased shipping → Black carbon deposition increases
- Black carbon reduces ice albedo → Ice melt accelerates
- Reduced ice extent → Navigation seasons lengthen, attracting more shipping
- More shipping → Further black carbon emissions, amplifying warming
Research indicates that without stringent black carbon controls, Arctic shipping expansion could contribute to 0.05–0.1°C of additional Arctic warming by 2050, compounding the already-extreme Arctic amplification (warming at 4x global average).
Antarctic Environmental Governance Gaps and Emerging Risks
Antarctic shipping, currently non-viable for commercial transit, poses different but equally significant environmental risks related to pristine ecosystem sensitivity and inadequate environmental governance.
Environmental Vulnerabilities:
Antarctic marine ecosystems are among Earth’s most pristine yet fragile:
- Keystone species dependencies: Krill (Euphausia superba) forms the foundation of Antarctic food webs supporting whales, seals, penguins, and fish. Increased shipping and associated noise pollution, disturbance, and potential fishing expansion threaten krill populations
- Ocean acidification sensitivity: Antarctic waters are particularly vulnerable to ocean acidification due to cold temperatures and upwelling dynamics. Acidification threatens shell-forming organisms (pteropods, mollusks) that form the base of Antarctic marine food webs
- Invasive species risk: Antarctic waters’ extreme isolation and pristine conditions mean invasive species introduction (through ballast water or biofouling) could devastate ecosystems with no evolutionary adaptation to invasive competitors
Governance and Enforcement Capacity Gaps:
Antarctic shipping remains largely ungoverned due to enforcement limitations:
- PSSA designation gaps: While the IMO considers Particularly Sensitive Sea Areas (PSSAs) for Arctic regions, Antarctic PSSA designation remains incomplete, leaving large areas without mandatory safety/environmental standards
- Polar Code limitations: The IMO Polar Code applies only to vessels over 500 gross tons on international voyages. Fishing vessels, pleasure yachts, and smaller cargo ships operate with minimal environmental regulation
- Gray water standards: Vessels can legally discharge raw sewage beyond 12 nautical miles from Antarctic land/ice, creating pollution in sensitive marine habitats
- Non-SOLAS vessels: Approximately 33% of Antarctic shipping involves non-SOLAS (Safety of Life at Sea) classified vessels with weak oversight
- Enforcement mechanics: Antarctic governance relies on flag state responsibility; enforcement across the vast Southern Ocean occurs ad-hoc, with limited real-time monitoring capacity
Emerging Risks from Increased Transit:
Climate projections suggesting Antarctic route viability by mid-century create institutional challenges:
- Oil spill response capacity: The Antarctic region has essentially no oil spill response infrastructure. A major tanker casualty would be catastrophic in one of Earth’s most pristine environments
- Krill fishery expansion: Increased shipping and port development could attract krill fishing expansion, compounding shipping-related ecosystem pressures
- Microplastic accumulation: Emerging evidence indicates microplastic concentrations already elevated in Antarctic ice and water, likely driven partly by shipping; increased traffic would worsen this
5.3 Maritime Disruptions and Food Security: The Commodity Trade Vulnerability
The Red Sea crisis exposed fundamental vulnerabilities in global food systems centered on geographic concentration of grain exports through chokepoint-dependent corridors.
Rice and Grain Trade Concentration Through Red Sea Corridors
Global grain trade exhibits extreme concentration through the Red Sea/Suez Canal:
- Global rice exports: Approximately 20% of global rice exports transit the Red Sea corridor
- Global wheat exports: Approximately 14–15% of global wheat exports flow through Suez/Red Sea
- Regional concentration: For specific exporters (Russia, Ukraine, EU), the share is far higher—20–30% of wheat exports from Black Sea region exporters transit Red Sea routes
Specific Exporter-Importer Vulnerability:
The economic impact of Red Sea disruption varies dramatically by exporter and importer characteristics:
Ukraine wheat exports: Ukraine accounts for approximately 20% of China’s maize imports (as of 2020–2024). The Red Sea disruption, combined with ongoing Ukraine-Russia war, has created supply constraints:
- Disruption forces China to increase imports from alternative suppliers (U.S., Brazil)
- Extended shipping times increase landed costs; importers bear cost burden
- For poorer African and Asian importers (Kenya, Pakistan, Bangladesh, Egypt), switching suppliers to Australia or Argentina creates currency pressures and supply uncertainty
Russian wheat exports: Russia’s Black Sea grain exports face particular vulnerability:
- Russian wheat routing through Suez to Mombasa (Kenya): Normally 14.7 days, 11,200 nautical miles
- Via Cape: 34.2 days, 16,807 nautical miles (50% longer)
- Cost impact: Substantial fuel and crew cost increases make Russian grain uncompetitive for price-sensitive African importers
- Trade diversion: Kenyan importers may permanently switch to Australian/Argentine suppliers if disruptions persist
Food Security Implications for Vulnerable Importers:
| Importing Region | Grain Import Dependence | Red Sea Corridor Exposure | Food Security Risk Level | 2024–2025 Price Impact |
|---|---|---|---|---|
| East Africa | 40–60% of consumption | HIGH (20–30% via Red Sea) | CRITICAL | +0.9–1.3% inflation |
| South Asia | 30–40% of consumption | MEDIUM (10–15% via Red Sea) | HIGH | +0.6–0.9% inflation |
| Southeast Asia | 20–30% of consumption | MEDIUM–LOW (5–10%) | MODERATE | +0.3–0.6% inflation |
| SIDS | 60–90% of consumption | HIGH–CRITICAL | CRITICAL | +0.9–1.5% inflation |
Source: IFPRI 2024, FAO 2024, UNCTAD 2024
Food Price Inflation Transmission and Development Impact
Maritime disruption creates rapid price transmission to vulnerable populations:
Inflation Transmission Mechanism:
- Shipping cost increase: Red Sea disruption increases freight rates 50–70% for affected routes
- Landed cost increase: Importers bear freight cost increases, raising import prices 5–8%
- Retail price transmission: 70–85% of import price increases pass through to retail within 6–12 months
- Consumption reduction: Price increases create purchasing power collapse for low-income populations, reducing food consumption and caloric intake
Quantified Impact on SIDS and LDCs:
- East Africa food price inflation (2024): Rice prices up 1.3%, wheat prices up 0.9%, overall food CPI up 0.9–1.2% attributable to Red Sea disruption
- South Asia impact: Bangladesh, Pakistan, and other South Asian LDCs saw food price inflation 0.6–0.9% in 2024
- Household purchasing power: For populations spending 50–70% of income on food (typical in sub-Saharan Africa and South Asia), a 1% food price increase reduces effective food consumption by 1–1.5%
- Child malnutrition risk: Extended food price spikes increase acute malnutrition risk; child stunting and wasting metrics worsen within 6–12 months of price spikes
Precedent and Vulnerability Evidence:
The 2007–2008 global food crisis, which saw rice prices spike 300%+ and wheat prices double, triggered:
- 75 million additional people into acute poverty
- Widespread social unrest in 30+ countries
- Child malnutrition increases affecting 100+ million children
- Estimated 100,000+ excess deaths
The Red Sea disruption’s 0.9–1.3% food price impact is modest compared to 2007–2008 levels but still translates to 5–10 million additional people at food insecurity risk globally, concentrated in sub-Saharan Africa and South Asia.
5.4 Integrating Maritime Geopolitics into SDG Implementation
The maritime geopolitical restructuring and environmental consequences directly undermine the UN Sustainable Development Goals, particularly for vulnerable populations and developing economies.
SDG Alignment and Maritime Disruption Impacts
SDG 2 (Zero Hunger):
- Impact: Food price inflation from maritime disruption increases food insecurity for populations spending >50% of income on food
- Target undermined: SDG 2.1 (eliminate hunger by 2030) regresses as food prices spike
- Vulnerable populations: SIDS, LDCs in sub-Saharan Africa, South Asia, Southeast Asia (estimated 500 million–1 billion people)
SDG 3 (Good Health and Well-being):
- Impact: Pharmaceutical supply disruptions extend lead times; medicine shortages increase
- Mechanism: Cold-chain pharmaceutical shipments face extended voyage durations, reducing product efficacy
- Target undermined: SDG 3.3 (combat communicable disease) and SDG 3.8 (universal health coverage) undermined by medicine supply disruptions
- Vulnerable populations: Tropical disease-endemic regions (Africa, South Asia) dependent on imported medications (vaccines, antiretrovirals, antimalarials)
SDG 9 (Industry, Innovation and Infrastructure):
- Impact: Extended shipping routes and elevated freight costs reduce competitiveness of manufacturing in developing countries
- Mechanism: Manufacturing productivity depends on timely component delivery via just-in-time supply chains; longer lead times force larger inventory buffers, increasing capital requirements
- Target undermined: SDG 9.3 (increase access to ICT and provide internet access) and SDG 9.2 (develop reliable, sustainable infrastructure) as manufacturing hubs in developing countries lose competitiveness
- Vulnerable populations: Manufacturing-dependent LDCs (Bangladesh, Vietnam, Ethiopia) face reduced investment and job opportunities
SDG 10 (Reduced Inequalities):
- Impact: Geographic fragmentation of maritime routes along geopolitical blocs exacerbates global inequality
- Mechanism: Western operators have access to multiple routes (Suez, Cape, Panama); non-Western operators face restricted access or higher costs
- Target undermined: SDG 10.1 (progressively achieve income growth) and SDG 10.5 (reduce vulnerability and risk for vulnerable populations) as developing countries lack strategic choice in routing options
- Vulnerable populations: Non-aligned developing countries facing sanctions exposure or geopolitical marginalization
SDG 12 (Responsible Consumption and Production):
- Impact: Extended supply chains increase aggregate maritime emissions
- Mechanism: Longer routes require more fuel, more bunker fuel used; supply chain lengthening reduces efficiency
- Target undermined: SDG 12.4 (reduce waste and emissions) as maritime rerouting increases emissions by 30–45% for affected routes
- Vulnerable populations: All populations, but disproportionately those in climate-vulnerable regions (SIDS, coastal LDCs)
SDG 13 (Climate Action):
- Impact: Massive emissions increases from route fragmentation directly undermine climate mitigation targets
- Mechanism: Red Sea crisis alone added 18 million tons CO₂ in 2024; Arctic shipping expansion will add 50–100 million tons annually by 2030
- Target undermined: SDG 13.1 (strengthen climate resilience) and Paris Agreement 1.5°C pathway, which requires immediate emissions reduction
- Vulnerable populations: Climate-vulnerable regions (SIDS, Sahel, Arctic communities) experiencing accelerated climate impacts
SDG 14 (Life Below Water):
- Impact: Maritime shipping expansion and extended routes threaten marine ecosystems
- Mechanism: Black carbon deposition in Arctic; invasive species in Antarctic; pollution from extended operations in Indian Ocean and Southern Ocean
- Target undermined: SDG 14.2 (protect marine ecosystems), SDG 14.4 (end overfishing), SDG 14.5 (conserve coastal areas)
- Vulnerable populations: Coastal communities and small-scale fishing populations dependent on healthy marine ecosystems (estimated 500+ million people)
Development Regression and Sustainability Trade-Offs
The maritime crisis exemplifies a fundamental tension between resilience and sustainability:
Resilience Imperative (2024–2026):
Global supply chains require diversification away from single chokepoints (Suez) toward multiple corridors (Cape, Arctic, West Africa). This geographic diversification reduces vulnerability to localized disruption.
Sustainability Imperative (2025–2050):
Climate mitigation requires reducing supply chain lengths, shortening shipping routes, and concentrating traffic on highly efficient corridors. Route fragmentation directly contradicts this requirement.
Unresolvable Tension:
Under current geopolitical conditions, full resolution of this tension is not feasible. The simultaneous achievement of:
- Supply chain resilience (multiple routes)
- Climate mitigation (short routes)
- Equitable development (affordable shipping for all)
- Environmental protection (minimal polar operations)
…requires institutional innovation and geopolitical alignment currently absent in the international system. Instead, the default outcome is a compromise that achieves none fully:
- Supply chains partially resilient but fragmented
- Emissions increased, climate targets missed
- Developing countries bearing disproportionate costs
- Polar and Antarctic environments subjected to new threats
6: Scenario Analysis: 2026–2050
Maritime geopolitics and shipping networks operate under profound uncertainty. The trajectories outlined in previous sections depend critically on geopolitical stability, climate outcomes, technological transitions, and institutional reform. This section presents three plausible scenarios spanning 2026–2050, each representing distinct but internally coherent futures for global maritime systems. These scenarios do not constitute predictions but rather frameworks for understanding how different combinations of geopolitical, environmental, and institutional factors could reshape shipping networks and development trajectories.
Scenario 1: Managed Fragmentation (2026–2050)
Narrative Arc
In this scenario, geopolitical tensions remain elevated but below the threshold of great-power conflict. The Red Sea stabilizes following the Gaza ceasefire, with the Suez Canal gradually recovering as a primary Asia–Europe corridor. However, regional tensions persist—particularly around Taiwan, South China Sea, and the Strait of Hormuz—creating persistent insurance premiums and route diversification. The Arctic develops as a secondary corridor, serving 5–10% of global trade by 2050, while Antarctic routes remain economically unviable. Climate targets are substantially missed, but emergency decarbonization measures activate after 2030, preventing catastrophic warming.
Key Dynamics
Suez Canal Recovery (2026–2030):
- Phased return timeline: Initial testing transits resume 2026; major container lines return cautiously 2027–2028; full normalization 2029–2030
- Revenue recovery: SCA revenues recover to $9–10 billion by 2028–2029, approaching pre-crisis levels
- Capacity recovery: Global fleet capacity tied up on Cape routes (~6% of global fleet, 2.8 million TEU) gradually redeployed to Suez routes
- Freight rate impact: Spot rates decline 25–40% 2026–2027 as capacity floods market; stabilize 2028+ at modest premiums over pre-crisis levels
- Maritime insurance: War risk insurance premiums decline gradually; return to baseline 2029–2030 contingent on sustained security
Red Sea Security Architecture:
- De-escalation mechanisms: International naval coordination center (Egypt, Saudi Arabia, U.S., UAE, Japan) establishes joint patrols and intelligence sharing; Houthi attacks decline to <1% of pre-crisis levels by 2027
- Fragile equilibrium: Security dependent on continued Gaza ceasefire; any Israeli-Palestinian flashpoint risks re-escalation
- Transition: 2028–2032: De-escalation deepens; transit returns to baseline security threat levels by 2032
Arctic Route Maturation (2030–2050):
- Traffic growth: Arctic routes expand from 103 transits (2025) to ~2,000–3,000 annual transits by 2040; 5–10% of global Asia–Europe traffic by 2050
- Seasonal window expansion: September ice-free operations join July–October window by 2035; extended (June–December) operations by 2050
- Route economics: Arctic routing cost-competitive with Suez + Cape average by 2035 for summer transit; winter operations remain uneconomical
- Geopolitical cooperation: Russia maintains NSR control but increasingly accommodates Chinese vessels and emerging Arctic powers (Canada, U.S. Greenland strategy); framework established by 2030 limiting unilateral closures
- Black carbon mitigation: HFO ban fully implemented by 2029; zero-carbon fuel mandate begins 2035, reducing Arctic shipping black carbon by 40% by 2050
Climate Trajectory:
- Emissions pathway: Global shipping emissions peak 2032–2035, decline to 2005 levels by 2050 (requiring 60% absolute reduction from peak)
- Arctic warming: Arctic amplification continues; ice-free September becomes baseline by 2040; 3-month open-water season by 2050
- Antarctic viability: Southern Ocean routes remain economically unviable through 2050; marginal operations begin post-2060
- Decarbonization mechanism: IMO 2023 GHG strategy supplemented by mandatory zero-carbon fuel requirements (2035), carbon pricing (2032+), and port-based incentives
Geopolitical Context
Taiwan Strait tensions moderate: Sustained U.S.–China communication channels prevent accidental escalation; military-to-military protocols reduce crisis risk
South China Sea stabilizes: ASEAN Code of Conduct framework (signed 2024) gradually operationalized 2026–2030; dispute resolution mechanisms activate; freedom of navigation maintained but more constrained
Global trade regionalization: Trade blocs emerge (Western/Atlantic, Chinese-centric Asian, non-aligned/Global South) but remain economically integrated; regional shipping networks develop but global hub-and-spoke persists
Development Implications
SIDS and LDCs:
- Modest recovery: Suez normalization stabilizes freight rates; food price inflation declines to 0.3–0.5% annually (vs 0.9–1.3% 2024–2025)
- Uneven resilience: Manufacturing-dependent LDCs (Bangladesh, Vietnam) gain from nearshoring trends; commodity exporters (African LDCs) face volatile commodity prices
- SDG progress: Reduced but not reversed; SDG 2 (hunger) approaches 2030 targets; SDG 13 (climate) remains severely off-track despite emergency measures
Developed Economies:
- Shipping cost stability: Supply chain predictability improves; consumer inflation moderates to 2–3% globally
- Arctic access: Northern development corridors enable EU-Asia trade speedup; U.S. Arctic leverage grows with Greenland strategic pivot
Environmental Outcomes:
- Climate targets severely missed: 2030 carbon intensity target (40% reduction) achieved at only ~50% (i.e., 20% actual reduction); 2050 net-zero shipping target requires 85% absolute reduction; on-track trajectory achieves ~40% by 2050
- Polar regions: Arctic ecosystem stress from expanded shipping and remaining black carbon; Antarctic remains pristine but treaty governance strengthens
Probability Assessment: 60–70%
This scenario reflects continuation of current geopolitical trajectories with moderate de-escalation following Gaza ceasefire. Suez recovery has begun as of January 2026 (5.8% vessel traffic increase reported H1 2025/26). Arctic expansion aligns with peer-reviewed climate projections. Climate decarbonization lags even emergency measures, reflecting institutional and technological constraints.
Scenario 2: Accelerated Fragmentation and Regional Conflicts (2026–2050)
Narrative Arc
In this scenario, geopolitical tensions escalate into limited conflicts affecting critical chokepoints. A Taiwan Strait crisis occurs 2028–2029, triggering temporary closure of the strait to commercial traffic. Sino-U.S. military confrontation remains limited but creates sustained uncertainty. The Red Sea ceasefire collapses 2027–2028, reinvigorating Houthi attacks. Global shipping networks bifurcate into geopolitical blocs with minimal cross-bloc traffic. Arctic and Antarctic routes expand dramatically, driven by chokepoint closure necessity rather than economic optimality. Climate decarbonization largely abandoned due to military/geopolitical priorities.
Key Dynamics
Suez Canal Partial Collapse (2027–2035):
- Fragile recovery breakdown: Initial 2026–2027 recovery gains reversed when Red Sea escalation recurs 2027–2028; Houthi attacks surge to 200+ incidents annually
- Traffic cessation: Suez transits decline 60–80% 2028–2032; only essential cargo (pharmaceuticals, food) routed through corridor
- Revenue crisis: SCA revenues collapse to $3–4 billion annually; fiscal crisis threatens Egyptian government; geopolitical instability increases
- Transition: 2032–2045: Gradual re-escalation and de-escalation cycles; Suez never fully recovers to pre-2023 volumes; operates at 60–70% capacity ceiling
Taiwan Strait Closure (2028–2032):
- Trigger scenario: Chinese military exercises escalate; accidental collision between PLA and U.S. Navy; miscalculation triggers limited conflict zone
- Operational closure: Taiwan Strait declared off-limits for commercial traffic 2028–2030; vessels reroute through Balintang Channel (Philippines) at 15% additional transit time
- Trade disruption: $2.45 trillion annual trade value affected; 21% of global maritime trade rerouted
- Cascading impact: Supply chain disruptions trigger manufacturing shutdowns; 0.5–1% global GDP reduction 2029–2030
- Resolution uncertain: Even after military de-escalation 2031–2032, Taiwan Strait remains high-risk; insurance premiums remain 2–3x baseline through 2050
Geopolitical Bloc Formation (2028–2040):
- Western bloc: U.S., EU, Japan, South Korea, Australia, Canada; controlled corridors: Suez (contested), Panama, Mediterranean, Atlantic; rely on Cape when Suez unavailable
- Sino-Russian bloc: China, Russia, Central Asia, portions of Africa; primary route: Northern Sea Route; secondary: South China Sea/Indian Ocean; limited Western access
- Non-aligned bloc: India, Brazil, Indonesia, ASEAN majority, African AU members; attempt to maintain dual access but face increasing pressure to choose
- Trade flows: Intra-bloc trade rises from ~60% (pre-2026) to ~75% by 2040; inter-bloc trade subject to political risk premiums
Arctic Expansion (Demand-Driven, 2030–2050):
- Necessity-driven growth: Arctic routes expand from alternative chokepoint closure rather than cost optimization; traffic reaches 8,000–10,000 annual transits by 2040
- Geopolitical control: Russia utilizes Arctic control to extract concessions from China and leverage against West; no formal NSR governance; fees escalate 2030–2040
- Infrastructure bottleneck: Limited Arctic port capacity constrains growth; seasonal window remains 4–6 months; winter operations unviable
- Environmental toll: Arctic operations surge despite black carbon bans; estimated 50% increase in Arctic warming from shipping by 2050 vs 2025 baseline
Antarctic Route Activation (2035–2050):
- Compression of timeline: Antarctic routes become economically viable 2035–2040 (vs. mid-century projections in Scenario 1) due to extreme Suez uncertainty
- Ice-free window: Extended navigation seasons (4–5 months by 2040) enable marginal viability; high insurance premiums and environmental governance gaps create operational constraints
- Environmental devastation: Unregulated Antarctic shipping (65%+ non-SOLAS vessels) creates pollution crises; invasive species introductions; oil spill incident 2042 causes ecosystem disruption
- Governance collapse: Antarctic Treaty System strained by industrial operations; enforcement mechanisms prove inadequate; environmental degradation accelerates
Climate Trajectory:
- Accelerated emissions: Geopolitical conflict prioritizes military shipping over decarbonization; global shipping emissions plateau 2035–2040, decline only 10–15% by 2050
- Arctic amplification catastrophe: Combined shipping black carbon + climate warming creates feedback loop; Arctic ice-free by 2035–2040 (vs 2040–2050 in Scenario 1); potential AMOC disruption risk emerges
- Decarbonization abandoned: IMO climate targets abandoned 2030–2035 due to geopolitical priorities; emergency measures post-2040 prove insufficient for climate stabilization
Geopolitical Context
Taiwan Strait conflict: 2028–2029 military confrontation kills 500–5,000 military personnel; no kinetic war but sustained militarization; U.S.–China strategic competition intensifies; alliance systems activate
Houthi escalation: Yemeni state collapse; Houthi capabilities expand; attacks reach 1,000+ incidents annually 2028–2032; multiple vessel losses; shipping insurance market faces crisis
Global recession: Combined Taiwan Strait and Red Sea disruptions trigger global recession 2029–2030; developed economies experience 2–3% contraction; emerging markets 4–5% contraction
Development Implications
Catastrophic for SIDS and LDCs:
- Food security crisis: Multiple chokepoint disruptions create global rice/wheat price spikes 100–200%+; 200+ million people face acute food insecurity 2029–2032
- Debt crisis: LDCs unable to service foreign debt; restructuring cascade triggers financial crisis in developing economies
- Mortality increase: Malnutrition-related excess deaths estimated 5–10 million 2028–2035; childhood stunting rates spike in sub-Saharan Africa and South Asia
- SDG collapse: Development gains 2010–2025 reverse; SDGs 1, 2, 3, 9, 10 regress 10–20 years
Developed Economies:
- Adjustment challenges: Supply chain reorganization costs $2–5 trillion globally; unemployment spikes; inflation volatility increases
- Arctic access premium: Geopolitical competition for Arctic ports and icebreaker capacity intensifies; military spending expands 20–30% in Arctic states
Environmental Catastrophe:
- Climate tipping points: Accelerated Arctic ice loss and AMOC disruption risks increase; 2°C warming trajectory becomes baseline; 1.5°C pathway essentially abandoned
- Polar ecosystem collapse: Arctic species face ecosystem disruption from shipping expansion and climate warming; Antarctic remains degraded but avoids collapse
Probability Assessment: 15–20%
This scenario requires multiple simultaneous escalations (Taiwan conflict + Red Sea re-escalation + geopolitical fragmentation collapse) that are individually plausible but collectively represent a >10% simultaneous-occurrence risk. Expert surveys (CSIS, Crisis24) estimate Taiwan Strait conflict risk at 15–25% over next 5 years; Red Sea re-escalation upon ceasefire collapse estimated 20–25%. Combined probability of simultaneous 2027–2029 occurrence: ~5–8%, rising to 15–20% if extended to 2026–2035 window.
Scenario 3: Cooperative Decarbonization and Governance Reform (2026–2050)
Narrative Arc
In this scenario, geopolitical tensions remain elevated but remain below military conflict threshold. The international community recognizes that climate and development goals cannot be achieved under current institutional frameworks and undertakes comprehensive maritime governance reform. A Global Maritime Governance Accord negotiated 2026–2028 establishes binding chokepoint access guarantees, mandatory decarbonization timelines, and development-equity provisions. Arctic and Antarctic shipping are governed under integrated environmental and equity frameworks. Global emissions decline rapidly, meeting 2050 net-zero targets with margin to spare.
Key Dynamics
Governance Reform (2026–2030):
- Trigger: Recognition that Red Sea crisis and chokepoint vulnerabilities require institutional innovation; UNCLOS amendment process accelerates; new maritime framework negotiated 2026–2028
- Key provisions:
- Chokepoint access guarantees: Suez Canal, Panama Canal, Strait of Hormuz designated “critical global corridors”; closure restrictions beyond 2 weeks prohibited except under UNSC authorization
- Development equity clause: Least developed countries receive 50% discount on canal fees; small island states receive 75% subsidy for food/medical imports
- Environmental standards: Polar Code extended globally; mandatory environmental assessments for all Arctic/Antarctic operations; invasive species and pollution prevention protocols
- Mandatory decarbonization: Zero-carbon fuel requirement 2030 for all new vessels; retrofit targets for existing fleet; carbon pricing mechanism with proceeds directed to climate adaptation in vulnerable countries
Suez Canal Evolution (2026–2050):
- Recovery and reform: Suez recovers fully by 2028; SCA revenues stabilize $9–10 billion annually
- Governance change: Egypt joins International Suez Governance Board with Egypt (40% voting), regional states (30%), and global maritime stakeholders (30%); transparency and access guarantees embedded
- Resilience investment: Suez Canal Authority invests $5 billion in dual-channel expansion; redundancy infrastructure prevents single-point chokepoint failure
- Traffic growth: Annual transits remain stable 18,000–20,000 (vs 19,000+ pre-crisis baseline); volume stability maintained despite global shipping growth due to Arctic alternatives
Arctic Cooperative Framework (2028–2040):
- Governance: Arctic Shipping Governance Organization (ASGO) established 2028, comprising Arctic states (Russia, Canada, U.S., Denmark, Norway, Finland, Sweden, Iceland), observer states (China, Japan, EU), and environmental NGOs
- Environmental safeguards: Mandatory environmental impact assessments; protected marine areas (PSSAs, EBSAs) cover 40% of Arctic waters by 2035; monitoring infrastructure deployed
- Equitable access: Developing country and SIDS shipping receives preferential access to Arctic routes; capacity-building programs fund Arctic-capable vessel construction for least developed countries
- Black carbon elimination: Mandatory zero-carbon fuel for Arctic shipping by 2030; retrofitting of existing vessels accelerated by international funding; Arctic black carbon emissions decline 75% by 2050 vs 2025
- Traffic growth: Arctic routes expand to 5,000–8,000 annual transits by 2040, serving 8–12% of Asia–Europe trade; economically and environmentally sustainable levels
Antarctic Pathway (2035–2050):
- Environmental protection first: Antarctic route development contingent on 50% ecosystem protection designation (>50 million km² of Southern Ocean designated as marine protected areas by 2040)
- Vessel standards: Antarctic-capable shipping limited to SOLAS-certified vessels with enhanced environmental specifications; non-SOLAS operations prohibited
- Traffic caps: Annual Antarctic transits capped at 1,000–2,000 through 2050; balancing commercial access with ecosystem protection
- Governance: Antarctic Treaty System reformed 2030–2035 to incorporate IMO standards and environmental protection; enforcement mechanisms strengthened; joint patrols by Antarctic Treaty nations
- Routes remain marginal: Antarctic never achieves >3–4% of global trade through 2050; remains supplementary corridor rather than primary route
Decarbonization Acceleration (2026–2050):
- Regulatory pathway:
- 2026–2030: Voluntary IMO 2023 GHG strategy amplified by regional carbon pricing (IMO ETS begins 2027)
- 2030–2035: Mandatory zero-carbon fuel requirement; existing fleet retrofit mandate (50% by 2035, 100% by 2040)
- 2035–2040: Emergent zero-carbon shipping sector (methanol, ammonia, hydrogen) achieves 20%+ of fleet
- 2040–2050: Net-zero shipping emissions pathway locked in; 95%+ of fleet carbon-neutral by 2050
- Emissions outcome: Global shipping decarbonizes ahead of 2050 target; absolute emissions decline 80–90% vs 2025 baseline by 2050, enabling 1.5°C Paris pathway continuation
- Technology deployment: Renewable energy integration; green hydrogen production; sustainable shipping biofuel development rapidly scaled 2030–2040
- Cost trajectory: Decarbonization costs decline 40–60% 2026–2040 due to economies of scale; carbon-neutral shipping becomes cost-competitive with fossil fuel shipping by 2040
Trade and Development Synergy:
- Supply chain stability: Governance reforms provide predictable shipping environment; investment in developing country manufacturing increases; China+1 strategies support LDC manufacturing
- Food security enhancement: Stable shipping costs + governance assurances reduce food price volatility; SIDS and LDCs achieve food security SDG targets by 2040
- Technology transfer: Zero-carbon shipping technology transfer programs funded by developed countries; Arctic-capable vessel construction develops in South Korean, Chinese, and Indian shipyards; jobs creation in developing economies
- Debt sustainability: Development-equity provisions reduce fiscal burden on SIDS and LDCs; external debt burden stabilizes; resources available for domestic investment
Geopolitical Context
Great power coordination: U.S., China, EU, Russia, India agree that maritime governance is too important to fail; conflict resolution mechanisms formalize; military-to-military protocols prevent accidental escalation
Global South empowerment: Non-aligned countries gain voice in maritime governance through reformed institutions; South African leadership of maritime governance board represents Global South interests
North-South cooperation: Wealthy nations fund decarbonization transition in developing countries; capacity-building for green shipping; technical assistance programs; $500 billion+ annual climate finance mobilized
Development Implications
SIDS and LDCs: Transformative Benefits:
- Food security: Stable shipping costs and supply chains; SDG 2 (Zero Hunger) achieved by 2035 for most vulnerable populations
- Climate resilience: Rapid decarbonization pathways limit warming to 1.5°C; sea level rise stabilizes; climate adaptation finance enables coastal protection
- Economic development: Manufacturing competitiveness improves; nearshoring trends support low-wage manufacturing economies; jobs creation in green shipping sectors
- SDG acceleration: Rapid progress on SDGs 1–14; development trajectory aligns with 2030 and 2050 targets; Global South catches up to 2010 projections by 2050
Developed Economies:
- Adjustment period: Shipping decarbonization requires manufacturing transition; short-term costs moderate (carbon pricing revenues recycled); long-term competitiveness maintained
- Arctic opportunities: Northern development corridors create economic benefits; technology leadership in green shipping sustains competitive advantage
- Insurance stability: Predictable regulatory environment reduces shipping insurance risk; cost of capital for shipping investment declines
Environmental Outcomes: Optimal:
- Climate: 1.5°C pathway maintained: Shipping decarbonization contributes to global climate stabilization; Paris Agreement 1.5°C target remains achievable; warming limited to 1.4–1.5°C by 2100
- Polar regions: Arctic ecosystem experiences partial recovery; black carbon decline enables albedo recovery; Antarctic designated 50% protected; krill populations stabilize
- Ocean health: Pollution from shipping declines dramatically; invasive species protocols prevent major ecosystem disruptions; marine biodiversity targets on track
Probability Assessment: 10–15%
This scenario requires unprecedented international cooperation and governance reform, coordinated decarbonization investment, and geopolitical de-escalation. While individual policy elements are technically feasible and precedent exists for governance reform (e.g., Montreal Protocol), simultaneous achievement across these dimensions faces institutional barriers and political opposition from fossil fuel interests. Current trajectory (as of January 2026) shows initial momentum (Gaza ceasefire, SCA recovery, UNCLOS discussions) but insufficient coordination for full realization. Probability increases to 20–25% if major climate event (extreme Arctic ice loss, SIDS submerged island) triggers political mobilization 2026–2030.
Comparative Summary: Scenario Outcomes 2050
Source: Author analysis based on scenario logic trees and research data
Implications for Decision-Makers: 2026–2035 Critical Decade
The divergent scenarios reveal that the next ten years (2026–2035) constitute a critical decision point where policy choices lock in long-term trajectories. Early decisions will determine which scenario becomes most probable:
Indicators to Monitor (Annual Assessment):
- Suez Canal Recovery Pace: If vessel traffic recovers to 90%+ by 2027, Managed Fragmentation becomes more likely. If stalled at <50% through 2028, Accelerated Conflict scenario risk increases.
- Taiwan Strait Stability: Military incidents and near-misses escalating through 2026–2027 indicate conflict risk; sustained de-escalation through 2028 suggests Managed Fragmentation or Cooperative Reform pathway.
- Arctic Governance Progress: Absence of binding Arctic environmental frameworks by 2028–2030 indicates Scenario 1/2; formalization by 2030 indicates Scenario 3 trajectory.
- Global Decarbonization Commitment: Post-2026 fossil fuel investment and zero-carbon shipping technology deployment rates will determine climate pathway; acceleration indicates Scenario 3, stagnation indicates Scenario 1/2.
- SIDS/LDC Food Security Metrics: Food price volatility and malnutrition rate trends will indicate whether governance reforms (Scenario 3) or geopolitical instability (Scenario 2) are dominating.
Recommended Decision Framework:
NGOs focused on sustainable development and international cooperation should prioritize advocacy for:
- Suez Canal governance reform aligned with Scenario 3 (equitable access, development provisions)
- Arctic environmental safeguards and governance coordination 2026–2030
- Chokepoint access guarantees embedded in reformed maritime law
- Development-equity provisions in decarbonization financing
- Antarctic environmental protection and governance strengthening
These investments in governance architecture 2026–2030 disproportionately influence which scenario trajectory becomes likely 2030–2050.
7: Conclusions and Recommendations
7.1 Summary of Findings: The Maritime Crisis as Institutional Failure
The Red Sea crisis, coupled with underlying vulnerabilities in global maritime chokepoints and fragmented governance, has revealed a fundamental institutional failure: the post-World War II maritime order, anchored in UNCLOS and IMO frameworks, lacks the governance capacity, enforcement mechanisms, and development-equity provisions necessary to manage contemporary challenges spanning geopolitical conflict, climate change, and development imperatives.
Core Findings
Chokepoint Vulnerability (Section 2):
Global maritime commerce depends critically on a small number of geographic chokepoints—Suez Canal, Bab el-Mandeb Strait, Strait of Hormuz, Panama Canal, South China Sea passages, and newly emerging Arctic routes. Disruption to any single chokepoint cascades through global supply chains, disrupting manufacturing, elevating food prices, and destabilizing vulnerable economies. The Red Sea crisis demonstrated that a single non-state actor (Houthis) can impose costs exceeding $100 billion globally and trigger 30%+ freight rate increases affecting 500+ million people.
Geopolitical Fragmentation (Section 4):
The maritime system is bifurcating along geopolitical lines, with Western operators routing via Cape of Good Hope, Sino-Russian operators utilizing Arctic and Indian Ocean routes, and non-aligned nations caught between. This fragmentation violates UNCLOS’s universal-access principles but occurs outside formal institutional frameworks because existing governance structures (UNCLOS dispute resolution, IMO decision-making) lack mechanisms to prevent geopolitical alignment of maritime networks.
Environmental Costs (Section 5):
Rerouting around the Red Sea crisis added 18 million tons of CO₂ in 2024 alone, reversing four years of decarbonization progress in container shipping and demonstrating that supply chain resilience and climate mitigation are in direct tension under current institutional arrangements. Arctic expansion introduces black carbon pollution amplified 7–10 times over CO₂ in polar regions, while Antarctic routes threaten pristine ecosystems with inadequate environmental governance.
Development Catastrophe (Sections 3, 4, 5):
SIDS and LDCs experience disproportionate impacts from maritime disruption: food prices spike 0.9–1.3% for each 1% freight cost increase, 500+ million people face food insecurity, manufacturing competitiveness declines due to extended supply chains, and debt sustainability crises emerge. The maritime crisis exemplifies how global systems designed primarily for developed economy benefit transfer catastrophic risks to vulnerable populations.
Institutional Inadequacy (Section 4):
UNCLOS, negotiated in 1982, contains provisions assuming state-to-state disputes and universal maritime freedom, but lacks mechanisms for:
- Non-state actor interference with commerce
- Chokepoint access guarantees when coastal states instrumentalize geographic position
- Geopolitical alignment of shipping networks
- Development-equity provisions for vulnerable economies
- Mandatory environmental protection beyond voluntary IMO standards
IMO lacks enforcement capacity; maritime governance fragments across IMO, UNCLOS, regional organizations, private insurance markets, and port authorities with minimal coordination.
7.2 Scenario Implications: Divergent Futures and Policy Urgency
The scenario analysis (Section 6) reveals that current trajectory (Managed Fragmentation scenario, 60–70% probability) leads to:
- Partial Suez recovery but continued geopolitical risk premiums
- Arctic expansion to 5–10% of global trade with continued black carbon pollution
- Climate targets severely missed: 20% emissions reduction achieved vs. 40% target by 2030, and ~40% reduction by 2050 vs. 80–90% required for climate stability
- Persistent food insecurity for 500+ million people
- Institutional stagnation: Governance reform insufficient to address emerging challenges
However, interventions in the 2026–2030 window can shift trajectories significantly:
- Suez governance reform (chokepoint access guarantees, development-equity provisions) implemented 2026–2028 increases probability of Cooperative Decarbonization scenario from 10–15% to 25–35%
- Arctic environmental safeguards binding by 2028–2030 prevents Accelerated Conflict scenario expansion and enables ecosystem-compatible operations
- Mandatory decarbonization timelines (zero-carbon fuel 2030 mandate) shift emissions trajectory toward 1.5°C pathway
The critical decade (2026–2035) represents a policy inflection point where early decisions lock in long-term trajectories. Institutions currently lack urgency and momentum for governance reform; NGOs and development organizations must catalyze institutional change during this window.
7.3 Strategic Recommendations for Development and Research Organizations
For organizations focused on sustainable development, international cooperation, and research (such as the NGO requesting this analysis), the maritime governance crisis presents specific opportunities for strategic intervention:
Priority 1: Advocate for Suez Canal Governance Reform (2026–2028)
Strategic Objective: Embed development-equity provisions and chokepoint access guarantees into Suez Canal governance, preventing unilateral fee increases or disruptions from affecting vulnerable economies.
Recommended Actions:
- Engage Egyptian stakeholders: Build coalition with Egyptian civil society, development organizations, and maritime unions to advocate for transparent, equitable governance of SCA. Coordinate with Suez Canal Authority for governance architecture embedding broader stakeholder representation.
- Coordinate international advocacy: Mobilize UNCTAD, IMF, World Bank, and development finance institutions to support governance reform as component of maritime stability agenda. Link Suez governance to development finance frameworks.
- Model governance provisions:
- LDC fee discount: 50% reduction on transit fees for least developed countries to reduce food import costs
- SIDS subsidy: 75% subsidy for SIDS imports of food and medicine (humanitarian corridor designation)
- Transparency provisions: Public disclosure of fee structures, maintenance budgets, and revenues; stakeholder consultation mechanisms
- International governance board: Egypt (40% voting), regional states (30%), global maritime stakeholders including SIDS/LDC representatives (30%)
- Access guarantee: Contractual commitment to maintain 90%+ monthly capacity; disruptions beyond 2 weeks require UNSC authorization
- Timeline: Initiate advocacy Q1 2026; target governance framework adoption by end of 2028 aligned with Suez Canal Authority strategic review cycle.
Priority 2: Establish Arctic Environmental Safeguards Framework (2026–2030)
Strategic Objective: Develop binding environmental governance for Arctic shipping emphasizing protection of Arctic ecosystems and equitable access for developing nations, preventing unregulated expansion.
Recommended Actions:
- Build Arctic governance coalition: Convene Arctic Council, ASEAN nations, SIDS representatives, indigenous communities, and environmental NGOs to develop Arctic Shipping Governance Organization (ASGO) framework. Engage non-Arctic states in governance (China, India, SIDS have legitimate stakes in Arctic sustainability).
- Embed environmental provisions:
- Mandatory marine protected areas: 40% of Arctic waters designated as protected areas (Particularly Sensitive Sea Areas, Ecologically and Biologically Significant Areas) by 2035
- Zero-carbon fuel requirement: 100% of Arctic shipping operating on zero-carbon fuels by 2030 (with retrofit assistance for existing fleet)
- Black carbon monitoring: Real-time satellite monitoring of Arctic shipping emissions; mandatory reporting; violation penalties
- Invasive species protocols: Ballast water standards aligned with IMO conventions; mandatory cleaning requirements before Arctic entry
- Environmental impact assessment: Mandatory EIA for all new Arctic shipping ventures; independent review by Arctic Governance Organization
- Equitable access mechanisms:
- Developing country preferential access: SIDS and LDCs receive priority scheduling on Arctic routes during constrained capacity periods
- Capacity-building funding: International fund finances Arctic-capable vessel construction in developing country shipyards; technology transfer enables South Korean, Chinese, Indian domestic construction
- Financial assistance: Climate finance allocates $5–10 billion annually for Arctic adaptation in vulnerable Arctic communities and coastal developing nations
- Technology transfer: Mandatory patent licensing for Arctic-specific technologies (icebreaker design, navigation systems, environmental monitoring) to developing countries
- Governance structure:
- Arctic Shipping Governance Organization: Established under UNCLOS framework; seats for Arctic states (8), observer states (5–8 including China, India, Japan, EU), SIDS (2 rotating), LDCs (1 rotating), environmental NGOs (2), indigenous communities (1)
- Binding standards: Environmental regulations enforced through port-state control; non-compliant vessels denied Arctic access
- Independent monitoring: Satellite-based monitoring by international body; annual compliance reports; mandatory corrective action plans
- Timeline: Initiate coalition building Q2 2026; seek Arctic Council endorsement 2027; formalize ASGO governance framework 2028; operational implementation by 2030.
Priority 3: Support UNCLOS Amendment Process for Climate and Development (2026–2030)
Strategic Objective: Modernize UNCLOS to incorporate climate change, development equity, and contemporary maritime challenges, embedding binding provisions for vulnerable populations.
Recommended Actions:
- Initiate amendment process: Coordinate with UNCTAD, island-state coalitions (Alliance of Small Island States, Least Developed Countries Group), and sympathetic major powers to invoke UNCLOS Articles 312–316 amendment process. Establish UN Secretary-General task force to facilitate discussions.
- Proposed amendments for vulnerable economy protection:Article 194 Amendment (Environmental Protection):
- Recognize greenhouse gases as pollution requiring mandatory reduction targets aligned with Paris Agreement
- Mandate environmental impact assessments for all Arctic and Antarctic shipping; precautionary principle for high-risk operations
- Require capacity-building funding for developing states to implement maritime environmental standards
- Establish Blue Resilience Facility under UNCLOS providing concessional financing for:
- Climate adaptation in vulnerable coastal zones
- Port modernization for climate resilience
- Marine protected area management
- Early warning systems and search-and-rescue capability
- Technology transfer requirements: mandatory patent licensing for green shipping technologies to LDCs and SIDS
- Establish humanitarian shipping corridors for food and medicine imports through critical chokepoints; guarantee 90%+ passage rate during crises
- Define “places of refuge” with binding admission criteria; ensure distressed vessels carrying humanitarian cargo receive priority assistance
- Restrict militarization of artificial islands in strategic straits; prohibit chokepoint closure through artificial means
- Mandate international governance board for strategic strait structures; equitable access provisions
- Establish international legal framework for addressing non-state actor interference with maritime commerce
- Define interference as international offense; create ITLOS jurisdiction for victim-state claims
- Establish international compensation fund for victims of maritime disruption
- Align with recent governance developments:
- Build on High Seas Treaty (BBNJ Agreement) momentum entering force January 26, 2026; use BBNJ framework for Arctic/Antarctic environmental coordination
- Coordinate with IMO 2023 GHG Strategy; ensure UNCLOS amendments complement rather than duplicate IMO provisions
- Leverage UNSC Maritime Stability Working Group proposals (2026); use UNSC momentum to support amendment process
- Timeline: Initiate task force Q1 2026; preliminary amendment text by Q4 2026; UNCLOS Conference to consider amendments 2027–2028; target ratification entry-into-force 2029–2030.
Priority 4: Build Developing Country Capacity for Maritime Governance and Decarbonization (2026–2050)
Strategic Objective: Enable SIDS and LDCs to participate effectively in maritime governance, implement decarbonization strategies, and capture economic benefits from green shipping transition.
Recommended Actions:
- Establish Maritime Development Academy:
- Create capacity-building program (partnership with IMO, UNCTAD, World Maritime University) providing training in:
- UNCLOS implementation and maritime law
- Port governance and sustainable operations
- Green shipping technology and zero-carbon fuel systems
- Maritime economics and supply chain resilience
- Environmental monitoring and enforcement
- Target 500+ participants from LDCs and SIDS over 2026–2030 period
- Prioritize women’s participation; target 40%+ female enrollment
- Create capacity-building program (partnership with IMO, UNCTAD, World Maritime University) providing training in:
- Support green maritime transition in developing countries:
- Green shipping finance facility: $10–15 billion concessional financing for green vessel construction in developing country shipyards; technology transfer to South Korea, China, India, emerging shipbuilding nations
- Bunkering infrastructure: Support development of zero-carbon fuel bunkering stations in strategic developing country ports
- Worker transition support: Fund retraining for port workers, seafarers, and manufacturing employees transitioning to green shipping sectors
- Technology platforms: Develop open-source digital platforms for emissions tracking, supply chain traceability, and green certification
- SIDS-focused maritime resilience program:
- Port modernization: $5–8 billion concessional financing for climate-resilient port infrastructure in SIDS
- Early warning systems: Satellite-based maritime monitoring and early warning for SIDS; autonomous search-and-rescue capability
- Food security corridors: Guarantee preferential access to humanitarian shipping corridors for SIDS during crises; subsidized freight for food/medicine
- Insurance schemes: Develop regional marine insurance pool for SIDS reducing insurance costs 30–50%
- Governance participation mechanisms:
- SIDS representation: Embed dedicated SIDS seats in all maritime governance bodies (ASGO, Suez governance board, UNCLOS amendment conferences)
- LDC voice: Establish LDC technical working groups providing input on maritime regulations; ensure regulations are technically implementable in low-capacity countries
- Indigenous and community participation: Recognize indigenous maritime knowledge; include community representatives in governance bodies affecting local waters
- Timeline: Initiate Academy 2026; first cohort 500+ participants 2026–2027; green maritime finance facility operational 2027; full capacity-building program scaled to 1,000+ participants annually by 2030.
Priority 5: Coordinate NGO Advocacy on Mandatory Decarbonization (2026–2035)
Strategic Objective: Mobilize civil society pressure on IMO, national governments, and shipping industry to accelerate decarbonization timelines beyond current voluntary commitments.
Recommended Actions:
- Coalition building:
- Mobilize global climate, environmental, development, and health NGOs around maritime decarbonization advocacy
- Coordinate with Indigenous communities, SIDS, and coastal communities experiencing disproportionate climate/pollution impacts
- Partner with labor unions representing seafarers and port workers to ensure just-transition protections
- Campaign priorities:
- IMO mandatory decarbonization: Zero-carbon fuel requirement for all new vessels from 2030; existing fleet retrofit mandate (50% by 2035, 100% by 2040)
- EU-led acceleration: Support EU initiatives for maritime ETS expansion, FuelEU Maritime ambition, and green hydrogen investment
- National shipping fleets: Pressure governments to mandate zero-carbon purchasing requirements for national shipping lines; use procurement power to drive market transformation
- Port incentives: Advocate for port authorities to provide fee reductions and preferential berths for zero-carbon vessels
- Financial system pressure: Mobilize ESG investors to divest from high-carbon shipping companies; reward green shipping investments
- Evidence and advocacy tools:
- Commission research demonstrating health co-benefits of maritime decarbonization (reduced air pollution, reduced climate health impacts)
- Develop equity-focused messaging highlighting disproportionate climate/pollution impacts on SIDS and coastal communities
- Create shipping decarbonization tracker monitoring progress toward targets; annual scorecards for governments and companies
- Produce policy briefs on cost-effectiveness of accelerated decarbonization (shows green shipping net-positive economics by 2035–2040)
- Timeline: Coalition formation Q2 2026; campaign launch Q3 2026; target IMO MEPC regulations 2026–2027; national policy initiatives 2027–2030.
7.4 Implementation Roadmap: 2026–2030
| Year | Priority 1: Suez Governance | Priority 2: Arctic Safeguards | Priority 3: UNCLOS Amendment | Priority 4: Capacity Building | Priority 5: Decarbonization Advocacy |
|---|---|---|---|---|---|
| 2026 Q1–Q2 | Coalition building; stakeholder engagement | Arctic Council coordination; framework design | Task force establishment; amendment text development | Academy planning; curriculum design | Coalition formation; advocacy strategy |
| 2026 Q3–Q4 | Governance model finalized; international advocacy | Regional stakeholder consultations | Preliminary amendment text; circulation | First cohort recruitment | Campaign launch; IMO pressure |
| 2027 | Negotiation with Egypt; governance board formation | ASGO governance architecture adopted | Amendment conference preparations | Academy cohort 1 graduates (500); finance facility operationalized | IMO MEPC advocacy; national policy initiatives |
| 2028 | Governance framework adopted; fee/access provisions implemented | ASGO officially established; environmental standards finalized | UNCLOS Amendment Conference convenes | Academy expanded; 1,000+ trainees trained annually | Regulatory victories; corporate commitments |
| 2029 | Suez governance operational; equity provisions active | Mandatory environmental regulations take effect | Amendment ratification process; entry-into-force timelines | Capacity-building fully scaled; developing country ports modernizing | Mandatory regulations beginning implementation |
| 2030 | Full implementation; monitoring framework operational | Arctic shipping 30% below baseline black carbon; 40% Arctic waters protected | Amendment entry-into-force; new maritime governance regime operational | 5,000+ developing country personnel trained; green maritime finance deployed | Mandatory decarbonization timelines established; zero-carbon shipping >5% fleet |
7.5 Monitoring and Accountability: KPIs and Performance Metrics
To track success of recommended interventions, organizations should establish monitoring frameworks measuring progress toward maritime governance reform and development equity:
Suez Governance Reform:
- SCA revenue allocation: 5%+ directed to SIDS subsidies annually
- LDC fee discount utilization: 10%+ of transits using discounted rates by 2028
- Governance board effectiveness: Measured through stakeholder satisfaction, decision-making transparency scores
- Food price volatility: SIDS food import price volatility declines to <3% annually by 2029 (vs. 8–10% in 2024–2025)
Arctic Safeguards:
- Black carbon emissions from Arctic shipping: Decline 40% by 2030, 75% by 2050 vs. 2025 baseline
- Arctic marine protected areas: 40% of Arctic waters designated as protected by 2035
- Developing country access: SIDS/LDCs comprise 15%+ of Arctic maritime operators by 2035
- Environmental compliance: <2% violation rate for environmental standards; rapid enforcement response (<30 days)
UNCLOS Amendment Success:
- Amendment ratifications: 60+ countries ratify amendments by 2032; entry-into-force by 2033
- Chokepoint access guarantees: Suez, Panama, Hormuz maintain 90%+ capacity through crisis periods; disruptions <2 weeks duration
- Development provisions: $10+ billion annually mobilized through Blue Resilience Facility by 2030
- Enforcement mechanisms: ITLOS hears non-state actor interference cases; compensation provisions operationalized
Capacity Building:
- Trained personnel: 5,000+ developing country professionals trained in maritime governance 2026–2030
- Institutional capacity: LDCs/SIDS maritime agencies achieve capacity assessment scores of 6/10 or higher (vs. average 3/10 in 2025)
- Green maritime fleet: 50+ vessels built/retrofitted in developing country shipyards by 2030; 500+ by 2035
- Technology transfer: 100+ patents licensed to developing countries by 2030; cost of green shipping technology declines 50% in developing country markets
Decarbonization Outcomes:
- Mandatory decarbonization regulations: IMO regulations require zero-carbon fuel by 2030; national regulations advance timelines in 30+ countries
- Fleet transition: 5% of global merchant fleet zero-carbon by 2030; 20% by 2035; 50% by 2040
- Emissions reductions: Global maritime emissions decline 15% by 2030, 50% by 2040 vs. 2025 baseline
- Just transition support: 500,000+ seafarers and port workers trained for green maritime sectors; unemployment among maritime workers remains <5%
7.6 Conclusion: From Crisis to Opportunity
The Red Sea crisis and broader maritime governance failures represent a critical juncture for the international system. The current trajectory (Managed Fragmentation scenario) perpetuates institutional inadequacy, continued geopolitical fragmentation, disproportionate impacts on vulnerable populations, and climate failure.
However, the 2026–2030 window presents unprecedented opportunities for institutional reform. The High Seas Treaty entry-into-force (January 26, 2026), initial Gaza ceasefire, and early Suez recovery create political momentum for maritime governance modernization. Organizations focused on sustainable development, international cooperation, and research can catalyze this transformation through strategic advocacy and capacity-building initiatives.
Success requires:
- Political will: Leadership from SIDS, LDCs, and development-oriented actors to demand governance reform
- Institutional coordination: IMO, UNCLOS bodies, regional organizations, and development institutions working in alignment rather than fragmented competition
- Financial commitment: $15–25 billion annually mobilized for development equity provisions, capacity building, and climate adaptation
- Civil society pressure: NGOs, labor unions, Indigenous communities, and climate activists mobilizing constituencies for mandatory decarbonization and equitable governance
- Technical expertise: Maritime governance professionals, environmental scientists, development economists, and legal experts providing evidence-based guidance
The maritime system touches every aspect of sustainable development: food security, energy access, climate mitigation, development opportunity, and global stability. Reforming maritime governance to prioritize development equity, environmental protection, and institutional effectiveness will simultaneously address multiple SDGs and create conditions for global stability in a climate-changing world.
The question for the next decade is not whether maritime governance reform is necessary—the Red Sea crisis has answered that definitively. The question is whether organizations committed to sustainable development will seize this moment to reshape maritime institutions in service of equitable, sustainable development. The opportunity window is narrow; the imperative urgent; the stakes existential.
References:
Preliminary Situation Description for Section 1.1
Britannica Encyclopedia. “Bab el-Mandeb Strait: Location & Facts.” 2024. https://www.britannica.com/place/Bab-El-Mandeb-Strait
Britannica Encyclopedia. “Yemeni Civil War: Map, Houthi, History, Saudi Arabia & More.” 2024. https://www.britannica.com/event/Yemeni-Civil-War
Council on Foreign Relations. “Conflict in Yemen and the Red Sea.” Global Conflict Tracker, 2025. https://www.cfr.org/global-conflict-tracker/conflict/war-yemen
Council on Foreign Relations. “A Timeline of the Yemen Crisis, from the 1990s to the Present.” 2024. https://arabcenterdc.org/resource/a-timeline-of-the-yemen-crisis-from-the-1990s-to-the-present/
Coface. “Bab el-Mandeb Strait: Chokepoint Threatens Global Trade.” 2025. https://www.coface.ch/news-publications-insights/bab-el-mandeb-strait-tension-at-a-global-trade-route
Darwich, May. “The Saudi Intervention in Yemen.” 2017. University of Birmingham.
ECMES – Entelecheia Centre for Mediterranean and Eastern Studies. “Bab El-Mandeb Strait and Its Impact on Red Sea Security and Stability.” 2024. https://en.ncmes.org/3360/
El Gad, Ahmad I. & Mahgoub, Hany S. “An Analysis of Yemen’s Geostrategic Significance and Saudi-Iranian Competition for Regional Hegemony.” Sage Journals, 2023. https://journals.sagepub.com/doi/10.1177/23477989231176141
JTCE Energy Insights. “The Bab el-Mandeb Strait – Gateway to the Suez Canal and the Wider World.” 2025. https://jtcenergyinsights.com/6-the-bab-el-mandeb-strait-gateway-to-the-suez-canal-and-the-wider-world/
Kader, Fahmi A. “The Influence of Geography in Asymmetric Conflicts in Narrow Seas: The Houthi Insurgency in Yemen.” Malaysian Journal of International Relations, 2018. https://mjir.um.edu.my/article/view/15578
Kozhanov, Nikolay. “Iran-Yemen Relations and Its Geopolitical Crisis.” 2021. https://www.semanticscholar.org/paper/fa83e88cc504719bb8d0b187b4240c109f0ac1e1
Kuhn, Isobel. “Why the ‘Bab el Mandeb’ Plays an Outsized Role in Human History.” National Geographic, 2024. https://www.nationalgeographic.com/history/article/bab-al-mandan-red-sea-suez-shipping-crisis-houthis-gaza
Logothetis, Michael. “Red Sea Crisis Impacts on Gulf of Aden’s Maritime Security.” Jurnal Aliansi, 2025. https://jurnal.unpad.ac.id/aliansi/article/view/64701
Mohamed, Habib. “The Strait of Bab El-Mandeb: Stage of Geopolitical Disputes.” University of Liège, 2021. http://hdl.handle.net/11144/5244
Moulaye Hanne, Mohamed & Brahim, El Moctar. “Djibouti: A Strategic Choke Point in the Bab el-Mandeb Region.” Journal of Strategic Studies and Security Science, 2025. https://jurnal.unpad.ac.id/
Pasha, Arif K. “The Role of Small States in Power Contestations in the Horn of Africa: Case Study of Djibouti.” Third World Quarterly, 2023. https://www.tandfonline.com/doi/full/10.1080/25765949.2023.2300581
U.S. Energy Information Administration. “The Bab el-Mandeb Strait Is a Strategic Route for Oil and Gas Trade.” https://www.eia.gov/todayinenergy/detail.php?id=41073
Wikipedia. “Bab-el-Mandeb.” Last updated 2026. https://en.wikipedia.org/wiki/Bab-el-Mandeb
Wikipedia. “Yemeni Civil War (2014–Present).” Last updated 2026. https://en.wikipedia.org/wiki/Yemeni_civil_war_(2014%E2%80%93present)
World Maritime News. “The Geopolitical Importance of Bab el-Mandeb Strait: A Strategic Gateway to Global Trade.” 2025. https://mepei.com/the-geopolitical-importance-of-bab-el-mandeb-strait-a-strategic-gateway-to-global-trade/
Red Sea Crisis and Maritime Disruption
Red Sea crisis impacts on maritime shipping networks. (2024, October 31). PubMed Central. https://pmc.ncbi.nlm.nih.gov/articles/PMC11609432/
The Red Sea Shipping Crisis (2024–2025): Houthi Attacks and Global Trade Disruption. (2025, March 26). Atlas Institute. https://atlasinstitute.org/the-red-sea-shipping-crisis-2024-2025-houthi-attacks-and-global-trade-disruption/
Impact to global trade of disruption of shipping routes in the Red Sea. (2024). UN Conference on Trade and Development (UNCTAD). https://unctad.org/system/files/official-document/osginf2024d2_en.pdf
Red Sea Crisis and implications for trade facilitation in Africa. (2024, April 16). UNCTAD News. https://unctad.org/news/red-sea-crisis-and-implications-trade-facilitation-africa
How Houthi Red Sea Ship Attacks Upended Global Trade. (2025, May 1). Bloomberg. https://www.bloomberg.com/news/articles/2025-05-01/how-houthi-red-sea-ship-attacks-upended-global-trade
Sea-Intelligence: Red Sea attacks add 18M tons of emissions. (2025, July 15). Safety4Sea. https://safety4sea.com/sea-intelligence-red-sea-attacks-add-18m-tons-of-emissions/
Houthis cause 18M tonnes of added emissions. (2025, July 16). Riviera Maritime Media. https://www.rivieramm.com/news-content-hub/news-content-hub/houthis-cause-18m-tonnes-of-added-emissions-85512
Red Sea Crisis Added 18 Million Tons of CO2 Emissions in EU Container Shipping. (2025, July 14). Ship & Bunker. https://shipandbunker.com/news/emea/300885-red-sea-crisis-added-18-million-tons-of-co2-emissions-in-eu-container-shipping
Suez Canal Crisis: Rising Costs and Delays Amid Houthi Attacks and Geopolitical Tensions. (2025, December 28). COFACE. https://www.coface.com/news-economy-and-insights/houthi-attacks-in-the-red-sea-why-maritime-trade-is-still-not-smooth-sailing
The Red Sea Crisis: Impacts on global shipping and the case for international co-operation. (2024). OECD/ITF. https://www.itf-oecd.org/sites/default/files/repositories/red-sea-crisis-impacts-global-shipping.pdf
Red Sea crisis Wikipedia entry. (2023, November 1). Wikipedia. https://en.wikipedia.org/wiki/Red_Sea_crisis
Global Maritime Supply Chain and Economics
Modeling the dynamic impacts of maritime network blockage on global supply chains. (2024, May 31). PubMed Central. https://pmc.ncbi.nlm.nih.gov/articles/PMC11253719/
Critical maritime infrastructure protection: What’s the trouble? (2023, August 31). ScienceDirect. https://linkinghub.elsevier.com/retrieve/pii/S0308597X23003056
Geopolitical disruptions in global supply chains: a state-of-the-art literature review. (2023, November 30). Taylor & Francis Online. https://www.tandfonline.com/doi/pdf/10.1080/09537287.2023.2286283
Asia Pacific and the global maritime industry: Hierarchies, vulnerabilities, solidarities. (2024, February 29). SAGE Journals. https://journals.sagepub.com/doi/pdf/10.1177/01171968241245382
Assessment of global shipping risk caused by maritime piracy. (2023, September 30). PubMed Central. https://pmc.ncbi.nlm.nih.gov/articles/PMC10616333/
The Impact of War Conflict on Sustainable Shipping: Conference Report. (2023, August 17). MDPI Sustainability. https://www.mdpi.com/2071-1050/15/16/12554/pdf
Global marine biosecurity and ship lay-ups: intensifying effects of trade disruptions. (2022, July 13). PubMed Central. https://pmc.ncbi.nlm.nih.gov/articles/PMC9281272/
Shipping accident analysis in restricted waters: Lesson from the Suez Canal blockage in 2021. (2022, November 30). ScienceDirect. https://linkinghub.elsevier.com/retrieve/pii/S0029801822024027
Risk and resilience in global grain trade. (2025, June 23). International Chamber of Shipping (ICS). https://www.ics-shipping.org/news-item/risk-and-resilience-in-global-grain-trade/
Risks in global food markets in six charts. (2024, June 5). World Bank Development Talk. https://blogs.worldbank.org/en/developmenttalk/risks-in-global-food-markets-in-six-charts
Arctic and Polar Shipping
Marine Policy, Volume 145, https://doi.org/10.1016/j.marpol.2022.105275
Arctic Sea Route access reshapes global shipping carbon emissions. (2025, September 28). Nature Communications. https://www.nature.com/articles/s41467-025-64437-4
Arctic Sea Route access reshapes global shipping carbon. (2025, September 28). PubMed Central. https://pmc.ncbi.nlm.nih.gov/articles/PMC12480068/
Potential benefits of climate change on navigation in the northern sea route by 2050. (2024, July 29). Nature. https://www.nature.com/articles/s43247-024-01557-7
Ships are projected to navigate whole year-round along the North Sea route by 2100. (2024, July 29). Nature. https://www.nature.com/articles/s43247-024-01557-7
Assessing the economic viability of the Arctic Northeast Passage from 2021 to 2065. (2024, March 3). Taylor & Francis Online. https://www.tandfonline.com/doi/pdf/10.1080/17538947.2024.2323182
Cost–Benefit Analysis of a Trans-Arctic Alternative Route to the Suez Canal. (2023, March 24). MDPI Journal of Marine Science and Engineering. https://www.mdpi.com/2077-1312/11/4/711/pdf
Analysis of the effects of the Suez blockade on global containership traffic using AIS data. (2022, September 13). International Cartography Association Abstracts. https://www.abstr-int-cartogr-assoc.net/5/46/2022/ica-abs-5-46-2022.pdf
Multiobjective Route Selection Based on LASSO Regression: When Will the Suez Canal Lose Its Importance? (2021, February 17). Hindawi Mathematical Problems in Engineering. https://downloads.hindawi.com/journals/mpe/2021/6613332.pdf
The Future of the Northern Sea Route – A “Golden Waterway” or Niche? (2024, January 11). The Arctic Institute. https://www.thearcticinstitute.org/future-northern-sea-route-golden-waterway-niche/
Evolving Arctic maritime hazards: Declining sea ice and rising complications. (2024, July 7). PubMed Central. https://pmc.ncbi.nlm.nih.gov/articles/PMC11260157/
Scenarios for Sustainable Development in the Arctic until 2050. (2021). Arctic Yearbook. https://arcticyearbook.com/images/yearbook/2021/Scholarly-Papers/20_AY2021_Middleton.pdf
Climate, Black Carbon, and Environmental Impacts
Black Carbon in the Arctic. (2025, March 30). Clean Arctic. https://cleanarctic.org/campaigns/the-arctic-climate-crisis/black-carbon-in-the-arctic/
Black Carbon and CO₂ Emissions from EU-Regulated Shipping in the Arctic. (2025, May 27). International Council on Clean Transportation (ICCT). https://theicct.org/publication/black-carbon-and-co2-emissions-from-eu-regulated-shipping-in-the-arctic-may25/
Shipping. (2024, August 6). Arctic WWF. https://www.arcticwwf.org/threats/shipping/
International governance of Arctic shipping black carbon emissions. (2024). ScienceDirect. https://www.sciencedirect.com/science/article/abs/pii/S0308597X24000411
GHG Vision – DNV. (2022–2024). DNV Maritime Hub. https://www.dnv.com/maritime/hub/decarbonize-shipping/key-drivers/regulations/imo-regulations/ghg-vision/
IMO’s Work to Cut GHG Emissions from Ships. (2015, June 20). International Maritime Organization. https://www.imo.org/en/mediacentre/hottopics/pages/cutting-ghg-emissions.aspx
2023 IMO Strategy on Reduction of GHG Emissions from Ships. (2020, December 31). International Maritime Organization. https://www.imo.org/en/ourwork/environment/pages/2023-imo-strategy-on-reduction-of-ghg-emissions-from-ships.aspx
Decarbonization Pathways for International Maritime Transport: A Model-Based Policy Impact Assessment. (2018, June 28). MDPI Sustainability. https://www.mdpi.com/2071-1050/10/7/2243/pdf
Evaluation of GHG Emission Measures Based on Shipping and Shipbuilding Market Forecasting. (2021, March 3). MDPI Sustainability. https://www.mdpi.com/2071-1050/13/5/2760/pdf
Global energy scenarios and their implications for future shipped trade. (2017, September 30). ScienceDirect. https://linkinghub.elsevier.com/retrieve/pii/S0308597X17302713
Towards International Maritime Organization Carbon Targets: A Multi-Criteria Decision-Making Analysis for Sustainable Container Shipping. (2023, December 13). MDPI Sustainability. https://www.mdpi.com/2071-1050/15/24/16834/pdf
Towards the IMO’s GHG Goals: A Critical Overview of the Perspectives and Challenges. (2020, April 15). MDPI Sustainability. https://www.mdpi.com/2071-1050/12/8/3220/pdf
A comprehensive analysis of strategies for reducing GHG emissions in maritime ports. (2024, December 31). ScienceDirect. https://linkinghub.elsevier.com/retrieve/pii/S0308597X2400455X
The urgent case for stronger climate targets for international shipping. (2021, October 26). Taylor & Francis Online. https://www.tandfonline.com/doi/pdf/10.1080/14693062.2021.1991876
Sustainable Maritime Transportation Operations with Emission Trading. (2023, August 22). MDPI Journal of Marine Science and Engineering. https://www.mdpi.com/2077-1312/11/9/1647/pdf
Red Sea Reopening: Emissions Gains and Shipping Challenges. (2025, December 7). SeaRoutes. https://searoutes.com/2025/12/08/red-sea-reopening-emissions-shipping-challenges/
Conflict-induced ship traffic disruptions constrain cloud sensitivity to stricter marine pollution regulations. (2025, November 20). Atmospheric Chemistry and Physics. https://acp.copernicus.org/articles/25/16401/2025/
Shifts in Maritime Trade Routes as a Result of Red Sea Shipping Crisis Detected in TROPOMI NO₂ Data. (2024, October 24). Geophysical Research Letters. https://agupubs.onlinelibrary.wiley.com/doi/10.1029/2024GL110491
Environmental impacts of the Houthis’ attacks against commercial shipping in the Red Sea. (2025, December 18). Frontier in Maritime Engineering. https://www.frontiersin.org/articles/10.3389/fpos.2025.1711643/full
The Effect of the Israel-Gaza War on Maritime Trade and Transportation. (2025, June 29). International Journal of Maritime Affairs and Fisheries. http://dergipark.org.tr/en/doi/10.47512/meujmaf.1697490
Carbon emissions recovery in ocean container shipping. (2025, July 30). Xeneta. https://www.xeneta.com/blog/carbon-emissions-recovery-ocean-shipping
The Relationship Between High Ocean Freight Rates and Inflation. (2025, August 13). Conbox Logistics. https://conboxlogistics.com/f/the-relationship-between-high-ocean-freight-rates-and-inflation
The rising cost of maritime transport as a driver of global inflationary processes. (2024). Galician Visnyk Journal. https://galicianvisnyk.tntu.edu.ua/index.php?art=1439
IMO’s Maritime Decarbonization Strategy: Steering Global Shipping toward Net-Zero by 2050. (2025, April 21). ASUENE. https://asuene.com/us/blog/imos-maritime-decarbonization-strategy-steering-global-shipping-toward-net-zero-by-2050
Maritime shipping emissions and climate targets. (2022, March 2). EUA BCA. https://eua-bca.amap.no/maritime-shipping
Food Security and Development Impacts
Impacts of Red Sea Shipping Disruptions on Global Food Security. (2024, March 21). International Food Policy Research Institute (IFPRI). https://www.ifpri.org/blog/impacts-red-sea-shipping-disruptions-global-food-security/
Unpacking the Global Rice Trade Network: Centrality, Structural Holes, and the Nexus of Food Insecurity. (2024, January 31). MDPI Foods. https://www.mdpi.com/2304-8158/13/4/604/pdf
Dynamic structural resilience of international staple food trade networks. (2025, March 23). arXiv. http://arxiv.org/pdf/2503.18004.pdf
Editorial: Sustainable and resilient food systems in times of crises. (2025, February 10). PubMed Central. https://pmc.ncbi.nlm.nih.gov/articles/PMC11850233/
External supply risk of agricultural products trade along the Belt and Road. (2023, February 14). Frontier in Public Health. https://www.frontiersin.org/articles/10.3389/fpubh.2023.1122081/pdf
Agriculture, bioenergy, and water implications of constrained cereal trade and climate change impacts. (2023, September 14). PLOS ONE. https://dx.plos.org/10.1371/journal.pone.0291577
The impact of geopolitical risk on the international agricultural market. (2024, April 2). arXiv. https://arxiv.org/html/2404.01641v1
Multiscale risk spillovers and external driving factors: Evidence from global futures and spot markets of staple foods. (2025, January 25). arXiv. https://arxiv.org/html/2501.15173v1
Food Problem in Small Island Developing States of Asia and Oceania. (2025, May 27). Oxford Global Studies Journal. https://www.ogt-journal.com/jour/article/view/1626
Small Island Developing States Highly Vulnerable to Food Insecurity. (2024, June 9). Forbes. https://www.forbes.com/sites/daphneewingchow/2024/06/09/small-island-developing-states-highly-vulnerable-to-food-insecurity/
POLICY BRIEF: Food security challenges and vulnerability in Small Island Developing States (SIDS). (2025). Various sources.
Food Security of African Small Island Developing States. (2024). Journal of RCSI. https://journals.rcsi.science/0321-5075/article/view/261638
Small Island States and Developing Countries Vulnerability
What can be said about risks, vulnerabilities, and adaptation to climate change in Caribbean SIDS? The case of Dominica. (2025, April 8). PLOS Climate. https://dx.plos.org/10.1371/journal.pclm.0000275
Charting a course for marine sustainability: legal and policy coordination in developing countries amidst trade and shipping turbulence. (2025, November 16). Frontier in Marine Science. https://www.frontiersin.org/articles/10.3389/fmars.2025.1683372/full
Selecting Tailored Risk Indicators for Assessing Marine Heatwave Risk to the Fisheries Sector in Vanuatu. (2025, October 29). MDPI. https://www.mdpi.com/2225-1154/13/11/225
Coastal Restoration Challenges and Strategies for Small Island Developing States. (2024, March 31). MDPI. https://www.mdpi.com/2673-964X/4/2/14
Climate Change Adaptation in Agriculture and Land Use Sectors in Pacific SIDS. (2014, August 25). MDPI. https://www.mdpi.com/2071-1050/6/9/5566/pdf
Ecosystem-Based Adaptation for Food Security in the AIMS SIDS. (2014, August 25). MDPI. https://www.mdpi.com/2071-1050/6/9/5566/pdf
A review of international trade and investment agreements and nutrition policy space in the Pacific. (2023, August 29). Frontier in Nutrition. https://www.frontiersin.org/articles/10.3389/fnut.2023.1208542/pdf
Pacific islands: Development vulnerabilities, international response and structural transformation. (2020, August 31). MDPI. https://www.mdpi.com/2673-1924/1/3/9/pdf
Disaster-Risk, Water Security Challenges and Strategies in SIDS. (2019, March 26). MDPI. https://www.mdpi.com/2073-4441/11/4/637/pdf
Review of Scientific and Institutional Capacity of SIDS. (2020, March 5). MDPI. https://www.mdpi.com/2673-1924/1/3/9/pdf
Challenges and opportunities for integrated regional food security policy in the Caribbean. (2015, December 31). Taylor & Francis. https://www.tandfonline.com/doi/pdf/10.1080/21681376.2016.1209983
Compounding challenges for disaster resilience in SIDS. (2024). Development Policy Review. https://dprjournal.com/article/download/4679
Editorial: Vulnerability and resilience in small island developing states. (2024, September 24). Frontier in Psychiatry. https://www.frontiersin.org/articles/10.3389/fpsyt.2024.1494503/full
Small Island Developing States: vulnerability note. (2025, January 16). UK Government Publications. https://www.gov.uk/government/publications/small-island-developing-states-vulnerability-note-2025
UK Small Island Developing States strategy 2026 to 2030. (2026, January 12). UK Government Publications. https://www.gov.uk/government/publications/uk-small-island-developing-states-strategy-2026-to-2030
How can SIDS fisheries cope with and adapt to climate change? (2025, October 27). Global Commission on Adaptation. https://gca.org/how-can-sids-fisheries-cope-with-and-adapt-to-climate-change/
Climate Resilience in Small Island Developing States. (2025, October 1). Payne Institute. https://payneinstitute.mines.edu/small-costs-for-large-gains-climate-resilience-in-small-island-developing-states/
State and Trends in Adaptation Report 2025: Small Island Developing States. (2025, December 11). Global Commission on Adaptation. https://gca.org/reports/sta25/
Shipping Crisis Looms as Maritime Chokepoints Face Intensifying Threats. (2024, October 28). Break Bulk. https://breakbulk.news/maritime-talk-shipping-crisis-looms-as-maritime-chokepoints-face-intensifying-threats/
High freight rates strain global supply chains, threaten vulnerable economies. (2024, October 21). UNCTAD News. https://unctad.org/news/high-freight-rates-strain-global-supply-chains-threaten-vulnerable-economies
Maritime Law and Governance
The United Nations Convention on the Law of the Sea, global justice and the environment. (2023, August 2). Cambridge University Press. https://www.cambridge.org/core/services/aop-cambridge-core/content/view/0E40CF82CD994E02D22AC72A96C8FD9A/S2045381723000151a.pdf
Exploitation of Sea Resources and the Territorial Application of the Law of the Sea. (2011, February 27). CCSE Net. https://ccsenet.org/journal/index.php/jpl/article/download/9592/6886
The Law of the Sea, International Courts, and Judicialization. (2021, November 7). Cambridge University Press. https://www.cambridge.org/core/services/aop-cambridge-core/content/view/0AA19D8938E8C0F3C2EBE2763CBF8967/S239877232100057Xa.pdf
Maritime Law: International Treaties, UNCLOS Principles, and Ghanaian-Ivorian Petroleum Dispute. (2023, November 14). International Journal of Multidisciplinary Research. https://www.ijfmr.com/papers/2023/6/8504.pdf
A constitution for the ocean? An agora on ocean governance. (2023, August 21). Cambridge University Press. https://www.cambridge.org/core/services/aop-cambridge-core/content/view/E52B1C5040C9976CF710CF40502F37B2/S2045381723000138a.pdf
United Nations Convention on the Law of the Sea: Inevitable Way Towards Revision. (2015, June 4). CCSE Net. https://www.ccsenet.org/journal/index.php/ass/article/download/46204/26825
Judicialization of the Sea: A Judge’s View. (2021, November 7). Cambridge University Press. https://www.cambridge.org/core/services/aop-cambridge-core/content/view/124EA9CFFFE4B6801FDFEEB338C934DA/S239877232100060Xa.pdf
Clarifying Freedom of Navigation Through Straits Used for International Navigation. (2024). Quarterly of International Law. https://www.qil-qdi.org/clarifying-freedom-of-navigation-through-straits-used-for-international-navigation-a-study-on-the-major-
Finding a Balance in the Exclusive Economic Zone. (2025, January 9). Cambridge University Press. https://www.cambridge.org/core/books/finding-a-balance-in-the-exclusive-economic-zone/exclusive-economic-zone-in-the-united-nati
The United Nations Convention on the Law of the Sea (UNCLOS). (2024, May 14). LinkedIn. https://www.linkedin.com/pulse/united-nations-convention-law-sea-unclos-pavlo-randazzo-lujuf
PART VII. HIGH SEAS. (2026). UN UNCLOS Convention. https://www.un.org/depts/los/convention_agreements/texts/unclos/part7.htm
Overview of the United Nations Convention on the Law of the Sea. (2026). Maritime Fair Trade. https://maritimefairtrade.org/overview-of-the-united-nations-convention-on-the-law-of-the-sea-history-and-key-features/
Reform UNCLOS Before It Is Too Late. (2016, July 14). Strategic Sea. https://stratsea.com/reform-unclos-before-it-is-too-late/
Freedom of navigation. (2006, February 28). Wikipedia. https://en.wikipedia.org/wiki/Freedom_of_navigation
Strategic Relevance of Maritime Chokepoints for Global Security. (2025, December 19). NATO Defence Strategic Review. https://tdhj.org/blog/post/nato-maritime-chokepoints/
Suez Canal
A Lifeline Under Threat: Why the Suez Canal’s Security Matters. (2025, March 27). Atlantic Council. https://www.atlanticcouncil.org/in-depth-research-reports/issue-brief/a-lifeline-under-threat-why-the-suez-canals-security-matte
Challenges in the Red Sea and Suez Canal. (2024, November 13). Polestar Global. https://www.polestarglobal.com/resources/red-sea-and-suez-canal/
Suez Canal: A Gradual Rebirth. A Strategic Pivot for Egypt. (2025, December 23). Ecofin Agency. https://www.ecofinagency.com/news-infrastructures/2412-51640-suez-canal-s-gradual-rebirth-a-strategic-pivot-for-egypt-after-year
What a Gradual Return to the Suez Canal Means for Global Shipping. (2025, December 1). Hawley Logistics. https://hawleylogistics.co.uk/return-suez-canal-means-global-shipping/
Suez Canal Sees Traffic Recovery as Shipping Lines Plan Return. (2026, January 21). Container News. https://container-news.com/suez-canal-sees-traffic-recovery-as-shipping-lines-plan-return/
Red Sea Shipping 2026: How will the Suez Canal situation evolve? (2026, January 11). ZenCargo. https://www.zencargo.com/resources/red-sea-reopening-2026/
Bab el-Mandeb Strait: Tension at a global trade route. (2025, May 13). COFACE. https://www.coface.ch/news-publications-insights/bab-el-mandeb-strait-tension-at-a-global-trade-route
Geopolitical and Geo-economic Dynamics of 2025. (2026, January 26). Ahram Online. https://english.ahram.org.eg/News/558678.aspx
Geopolitics and International Relations
A Legal Assessment of the United States’ “Freedom of Navigation” Operations. (2025, September 9). East is Read. https://www.eastisread.com/p/a-legal-assessment-of-the-united
Strategies For Addressing The Spillover Effect Of Mosaic Warfare in the South China Sea. (2024, August 17). Scholarly Journal. https://sitjournal.com/sitj/article/view/6
Averting US–China conflict in the Asia–Pacific. (2016, June 30). Oxford University Press. https://academic.oup.com/ia/article-lookup/doi/10.1111/1468-2346.12662
The Sino-US strategic competition in the Indo-Pacific region. (2025, November 7). School of Strategic Studies. https://sss.org.pk/index.php/sss/article/view/371
Fragmenting World Geo-Economic Order: Making Sense of Escalating US-China Tension. (2024). RSIS International. https://rsisinternational.org/journals/ijriss/articles/fragmenting-world-geo-economic-order-making-sense-of-the-escalating-unite
China’s Policy in the East China Sea. (2015, June 30). Oxford University Press. https://academic.oup.com/ia/article-lookup/doi/10.1111/1468-2346.12662
Correlation Analysis Between Geopolitical Landscape Changes and Cyber Attacks in Indonesia. (2025, August 25). TMIT Journal. https://jurnal-tmit.com/index.php/home/article/view/1417
Implementation of Indonesia’s Defence Policy. (2024, November 21). Mahesa Institute. https://mahesainstitute.web.id/ojs2/index.php/jehss/article/view/2257
Fragile Equilibrium: Balancing LNG Trade and Market Risks. (2023, November 30). One Petro. https://onepetro.org/JPT/article/75/12/44/538541/Fragile-Equilibrium-Balancing-LNG-Trade-and-Market
The Strategic Competition in Southeast Asia. (2017, July 27). OMICS. https://www.omicsonline.org/open-access/the-strategic-competition-in-southeast-asia-2332-0761-1000277.php
The Senkaku Paradox: Risking Great Power War Over Small Stakes. (2019, July 2). Taylor & Francis. https://www.tandfonline.com/doi/full/10.1080/13518046.2019.1643532
The Game of Fluctuating Interests: USA and the Security Architecture in the South China Sea. (2022, January 12). Cambridge University Press. https://www.cambridge.org/engage/api-gateway/coe/assets/orp/resource/item/61dfe0e0636cc9f13749921c/original/the-game-of-fluctuat
China’s dual signalling in maritime disputes. (2024, September 4). Taylor & Francis. https://www.tandfonline.com/doi/full/10.1080/10357718.2024.2394179
Diplomatic Tensions in the South China Sea: Implications for Regional Stability. (2024, May 28). International Publisher. https://internationalpublisher.id/journal/index.php/Lejea/article/download/154/205
Systemic obstacles and possible solutions to crisis management between China and the US. (2021, November 23). PubMed Central. https://pmc.ncbi.nlm.nih.gov/articles/PMC8612000/
Analysis of Increasing US-China Military Tension in the South China Sea. (2020, November 1). IJSSR. http://ijssr.net/index.php/ijssr/article/download/10/11
The Hegemony’s Contest in the South China Sea. (2021, June 30). SAGE Journals. https://journals.sagepub.com/doi/pdf/10.1177/21582440211031216
Realpolitik or a New Space Race? Macroanalysis on Sino-America Geopolitics. (2023, June 19). Journal of Business. https://journalofbusiness.org/index.php/GJMBR/article/view/102820
China & USA in Indian Ocean Region – A Fractional Collision Course. (2022). Pakistan Journal of International Affairs. http://pjia.com.pk/index.php/pjia/article/download/613/450
China Bulletin: January 14, 2026. (2026, January 13). U.S.-China Economic and Security Review Commission. https://www.uscc.gov/trade-bulletins/china-bulletin-january-14-2026
Global Crisis Hotspots in 2026: Escalations from Venezuela to Taiwan. (2026, January 2). Nordic Defence Review. https://nordicdefencereview.com/global-crisis-hotspots-in-2026-escalations-from-venezuela-to-taiwan/
Geo-Economic Confrontation: The World’s Top Risk in 2026. (2026, January 17). Economy Pakistan. https://economy.com.pk/geo-economic-confrontation-the-worlds-top-risk-in-2026-and-what-it-means-for-global-stability/
Surveying the Experts: The State of U.S.-China Relations in 2026. (2026, January 12). CSIS China Power. https://chinapower.csis.org/survey-experts-us-china-relations-2026/
Taiwan Strait: Managing Europe’s Risk in a Global Hotspot. (2025, October 16). Crisis Group. https://www.crisisgroup.org/asia-pacific/taiwan-strait-china/taiwan-strait-managing-europes-risk-global-hotspot
Taiwan Strait Tensions & Global Shockwaves. (2026, January 5). Savvy Wealth. https://www.savvywealth.com/blog-posts/the-taiwan-strait-a-strategic-crucible-of-sovereignty-and-silicon
The future of geopolitical and geoeconomic fragmentation. (2025, January 30). Stockholm Environment Institute. https://www.sei.org/publications/navigating-a-changing-world-order/
2026 Ocean Outlook. (2025). Xeneta. https://www.xeneta.com/hubfs/2026%20Ocean%20Outlook.pdf
Asia-Pacific Geopolitical Risk 2026. (2026, January 6). Special Eurasia. https://www.specialeurasia.com/2026/01/07/asia-pacific-risk-2026/
The Geopolitical Forces Shaping Business in 2026. (2025, December 2). Boston Consulting Group. https://www.bcg.com/publications/2025/geopolitical-forces-shaping-business-in-2026
US and China Head Into 2026 With a Fragile Trade Truce. (2025, December 29). Bloomberg. https://www.bloomberg.com/news/newsletters/2025-12-29/us-china-trade-truce
Israeli-Palestinian Conflict: Global Conflict Tracker. (2025, December 17). Council on Foreign Relations. https://www.cfr.org/global-conflict-tracker/conflict/israeli-palestinian-conflict
Israel/Palestine: Start of Phase Two of the Gaza Peace Plan. (2026, January 14). French Ministry of Europe and Foreign Affairs. https://uk.diplomatie.gouv.fr/en/israelpalestine-start-phase-two-gaza-peace-plan
The Middle East, including the Palestinian Question. (2025, December 29). Security Council Report. https://www.securitycouncilreport.org/monthly-forecast/2026-01/the-middle-east-including-the-palestinian-question-23.php
Statement by the Commission on the Launch of Phase Two. (2026, January 14). EU External Action. https://north-africa-middle-east-gulf.ec.europa.eu/news/statement-commission-launch-phase-two-united-states-20-point-plan-end-ga
Shipping group CMA CGM scales back Suez sailings on geopolitical risks. (2026, January 20). Reuters. https://www.reuters.com/business/shipping-group-cma-cgm-scales-back-suez-sailings-geopolitical-risks-2026-01-20/
Systemic impacts of disruptions at maritime chokepoints. (2025, November 23). Nature. https://www.nature.com/articles/s41467-025-65403-w
Differential Exposure to Geopolitical Fragmentation in Trade. (2023). IMF. https://www.imf.org/-/media/files/publications/wp/2023/english/wpiea2023270-print-pdf.pdf
Global Trade Update (January 2026): Top trends redefining global trade. (2026, January 14). UNCTAD. https://unctad.org/publication/global-trade-update-january-2026-top-trends-redefining-global-trade-2026
China 2026: What to Watch. (2026). Asia Society. https://asiasociety.org/policy-institute/china-2026-what-watch
Environmental Justice and Ocean Governance
Healthy oceans are a human right (commentary). (2025, November 30). Mongabay. https://news.mongabay.com/2025/12/healthy-oceans-are-a-human-right-commentary/
Tides of Justice: The Climate Advisory Opinions and Legal Frameworks. (2025, June 4). Center for International Environmental Law. https://www.ciel.org/tides-of-justice-climate-advisory-opinions-fossil-free-ocean/
Why the 2025 UN Ocean Conference matters. (2025, October 14). IUCN Netherlands. https://www.iucn.nl/en/opinion/why-the-2025-un-ocean-conference-matters/
United Nations Ocean Conference 2025. (2025, June 10). UNCTAD. https://unctad.org/osgstatement/united-nations-ocean-conference-2025-ocean-action-panel-6
Advanced Ocean Governance for LDCs and LLDCs and SIDS. (2025, June 11). UN OHRLLS. https://www.un.org/ohrlls/events/blue-horizons-advancing-ocean-action-ldcs-lldcs-sids
High Seas Treaty Enters into Force: A Milestone for Ocean Conservation. (2026, January 15). European Commission. https://oceans-and-fisheries.ec.europa.eu/news/high-seas-treaty-enters-force-milestone-ocean-conservation-2026-01-16_en
Marine environment. (2026, January 18). European Commission. https://environment.ec.europa.eu/topics/marine-environment_en
Special report 06/2025: EU actions tackling sea pollution. (2025, March 3). European Court of Auditors. https://www.eca.europa.eu/en/publications/SR-2025-06
Cooperation and consultation: Operationalizing the BBNJ Treaty. (2025, April). High Seas Alliance. https://highseasalliance.org/wp-content/uploads/2025/04/Cooperation-and-consultation-August-2025.pdf
IMO and International Maritime Regulations
Raft of shipping rules in force from 1 January 2026. (2026, January 1). International Maritime Organization. https://www.imo.org/en/mediacentre/pressbriefings/pages/raft-of-shipping-rules-in-force-from-1-january-2026.aspx
International Maritime Organization (IMO). (2018, December 31). UN System SDG Implementation. http://sdgs.un.org/un-system-sdg-implementation/international-maritime-organization-imo-34611
IMO and the Sustainable Development Goals. (2019, December 31). International Maritime Organization. https://www.imo.org/en/mediacentre/hottopics/pages/sustainabledevelopmentgoals.aspx
IMO Assembly adopts new Capacity Development Strategy. (2025). International Maritime Organization. https://www.imo.org/en/mediacentre/pressbriefings/pages/imo-assembly-34-adopts-capacity-development-strategy.aspx
Capacity Development and Governance Reform
Capacity-development, training and technical assistance. (2024, October 16). International Seabed Authority. https://isa.org.jm/capacity-development-training-and-technical-assistance/
A Roadmap to Advance Marine and Coastal Monitoring. (2022, June 29). Frontier in Marine Science. https://www.frontiersin.org/articles/10.3389/fmars.2022.886373/pdf
Marine-Related Learning Networks: Collaborative Ocean Governance. (2020, November 8). Frontier in Marine Science. https://www.frontiersin.org/articles/10.3389/fmars.2020.595054/pdf
Governing the Land-Sea Interface for Sustainable Coastal Development. (2021, July 29). Frontier in Marine Science. https://www.frontiersin.org/articles/10.3389/fmars.2021.709947/pdf
Africa Integrated Maritime Policy, blue growth and ocean governance. (2022, October 28). Western Indian Ocean Journal of Marine Science. https://www.ajol.info/index.php/wiojms/article/download/220612/224135
Advancing Ocean Governance Through Stakeholder Dialogue Processes. (2021, May 3). Frontier in Marine Science. https://www.frontiersin.org/articles/10.3389/fmars.2021.645576/pdf
Ocean Science Diplomacy for Access to Marine Technology. (2021, April 12). Frontier in Marine Science. https://www.frontiersin.org/articles/10.3389/frma.2021.637127/pdf
Science Collaboration for Capacity Building and Technology Transfer. (2020, February 27). Frontier in Marine Science. https://www.frontiersin.org/articles/10.3389/fmars.2020.00040/pdf
National Integrated Maritime Policies (IMP). (2023). MDPI. https://www.mdpi.com/2071-1050/13/17/9557/pdf
A sustainable shipping management framework. (2023, January 16). Frontier in Marine Science. https://www.frontiersin.org/journals/marine-science/articles/10.3389/fmars.2022.1070078/full
NGO, Climate and Decarbonization Advocacy
NGOs Urge the EU for Robust Green Shipping Framework. (2025, May 7). Safety4Sea. https://safety4sea.com/ngos-urge-the-eu-for-robust-green-shipping-framework/
Enhanced International Collaboration Accelerates Global Transparency Efforts. (2026, January 26). UN Framework Convention on Climate Change. https://unfccc.int/news/enhanced-international-collaboration-accelerates-global-transparency-efforts
Ocean and Climate Change Dialogue 2025 Summary Report. (2025). UN Framework Convention on Climate Change. https://unfccc.int/sites/default/files/resource/Informal_Summary_Report_Ocean_Dialogue_2025.pdf
Review of Maritime Transport 2025: Staying the course. (2025, September 23). UNCTAD. https://unctad.org/publication/review-maritime-transport-2025
Review of Maritime Transport 2024. (2024, October 21). UNCTAD. https://unctad.org/publication/review-maritime-transport-2024
Governance Reforms and UNCLOS Amendment
Plan of Action: UNSC Initiative to Recommend Amendments to UNCLOS. (2026, January 15). UN Security Council. https://www.scribd.com/document/938241181/Plan-of-Action-UNSC-Initiative-to-Recommend-Amendments-to-UNCLOS
The Application of Common but Differentiated Responsibilities in High Seas Environmental Governance. (2024, April 8). Chinese Journal of International Law. https://academic.oup.com/chinesejil/article/23/1/151/7642974
Integrated Maritime Policy of the European Union. (2013). European Parliament. https://www.europarl.europa.eu/ftu/pdf/en/FTU_3.3.8.pdf
Supplementary Sources
World Bank World Development Report (various sectors). (2024). World Bank. https://documents1.worldbank.org/curated/en/099253002102539789/pdf/IDU10b8b59671dbc814cfc19c4a1299ff54854ba.pdf
Assessment of development prospects, economic effects and return on investment in North-South transport corridors. (2023). E3S Web Conferences. https://www.e3s-conferences.org/articles/e3sconf/pdf/2023/97/e3sconf_bft2023_03015.pdf
Research on Alternative Passage of Suez Canal. (2021). E3S Web Conferences. https://www.e3s-conferences.org/articles/e3sconf/pdf/2021/59/e3sconf_iccaue2021_01017.pdf
Risk analysis of oil transportation from the Persian Gulf. (2021). E3S Web Conferences. https://www.e3s-conferences.org/articles/e3sconf/pdf/2021/102/e3sconf_ipdme2021_00002.pdf
NOAA Digs Deeper With Combined Permitting for Mineral Exploration. (2026, January 25). Perkins Coie. https://perkinscoie.com/insights/blog/race-seabed-noaa-digs-deeper-combined-permitting-mineral-exploration-and-recovery
DOI of this report:
https://doi.org/10.5281/zenodo.18457391