
1. Executive summary
This report analyzes why Spain combines robust post‑pandemic job creation and record employment with persistently high unemployment, especially among young people and the long‑term unemployed, as well as widespread job instability, in‑work poverty and strong regional and social disparities, compared with major EU economies such as France, Germany, Italy, Portugal and Ireland. The central question is whether Spain’s specific fiscal and administrative regime for the self‑employed and micro‑enterprises (high fixed social contributions, no general VAT registration threshold, burdensome start‑up procedures) acts as a structural barrier that worsens labour‑market outcomes, or whether deeper structural features of the productive system and labour institutions are more decisive.
The first part of the report documents the empirical “anomaly”: Spain has the highest unemployment rate in the EU and OECD, one of the highest youth and long‑term unemployment rates, and elevated levels of in‑work poverty, despite strong job creation and only average labour tax wedges and labour costs by European standards. Spain’s employment rate remains several percentage points below the EU average, and regional disparities in unemployment are among the largest in Europe. This section also establishes that Spain’s labour‑market performance diverges not only cyclically but structurally from that of its main peers.
The second part reviews the conventional structural explanations: a production model biased towards low‑productivity services, construction and tourism; a firm size distribution dominated by micro‑enterprises and a deficit of medium‑sized firms; a polarised skills structure with many low‑educated adults and significant skill mismatches; and a dual labour‑market regime that has historically relied on temporary contracts as the main adjustment margin. Territorial fragmentation and high levels of social exclusion, as documented by FOESSA and Cáritas, further undermine the capacity of employment to act as a reliable route out of poverty. The literature consistently finds that these “four structural pillars” explain most of the gap between Spain and the best‑performing EU labour markets.
The third part formulates and tests a specific hypothesis: that Spain’s high fixed social contributions for the self‑employed, the absence of a general VAT registration or exemption threshold and comparatively burdensome administrative procedures for very small businesses constitute a distinctive institutional barrier that depresses self‑employment and SME creation, thereby worsening labour‑market outcomes. We compare Spain’s institutional design with that of EU peers and derive clear empirical implications: if the hypothesis in its strong form were correct, Spain should exhibit significantly lower self‑employment rates, lower enterprise birth rates and a thinner micro‑firm sector than comparable countries.
The empirical test does not support this strong version of the hypothesis. Spain’s self‑employment share is slightly above the EU average and higher than in France, Germany, Portugal or Ireland, and Spain has the third‑largest number of active enterprises in the EU, with firm‑birth rates around or slightly above the EU average. The evidence points instead to a different mechanism: fiscal and administrative barriers act as filters and amplifiers rather than primary causes. They shape who can afford to become formally self‑employed, push a segment of activity into informality or dependent self‑employment, and limit the ability of very small projects to experiment and scale up into more productive SMEs, especially for young people, women and migrants.
The report therefore concludes that Spain’s labour‑market under‑performance is best understood as the outcome of deep structural characteristics of its productive system, skills base, labour‑market institutions and territorial and social fragmentation, with fiscal and administrative barriers at the bottom of the system playing a non‑negligible but second‑order role. Policy recommendations must reflect this dual reality. On the one hand, a core structural agenda is needed to upgrade productivity and the production model, close skills gaps, consolidate labour‑market reforms and strengthen active labour‑market policies and social protection. On the other hand, a targeted fiscal and administrative agenda should reduce fixed entry and compliance costs for low‑income self‑employed workers and micro‑enterprises—through truly income‑related contributions, an effective VAT threshold and simplified regimes, and streamlined registration procedures—thus supporting more inclusive and sustainable entrepreneurship in line with SDG 8 and Spain’s 2030 Sustainable Development Strategy.
2. Table of contents
- Executive Summary
- Table of Contents
- Methodology and Analytical Framework
3.1. Research questions and hypotheses
3.2. Comparative scope and country selection
3.3. Data sources and indicators
3.4. Limitations and caveats - Spain in the European Labour Market: Stylized Facts
4.1. Core labour‑market outcomes: employment, unemployment, slack
4.2. Youth and long‑term unemployment
4.3. Job quality: temporary work, part‑time and in‑work poverty
4.4. Regional and social inequalities - Structural Determinants Beyond Taxation
5.1. Productive model and firm size distribution
5.2. Human capital, skill mismatches and NEETs
5.3. Labour‑market institutions and duality
5.4. Territorial fragmentation and social exclusion
5.5. Interim conclusion: the four structural pillars - The Conventional View on Taxes and Business Climate
6.1. The labour tax wedge in comparative perspective
6.2. Labour costs and competitiveness
6.3. General business environment indicators
6.4. Why a “high taxes” explanation fails for Spain - Hypothesis: Fiscal and Administrative Barriers to Self‑Employment and Micro‑Entrepreneurship
7.1. Formulating H1 and H0
7.2. Spain’s institutional design for the self‑employed and micro‑firms
7.3. Expected causal mechanisms - Testing the Hypothesis
8.1. Self‑employment rates: Spain vs. EU peers
8.2. Business demography: enterprise births, deaths and survival
8.3. Firm dynamics and the scaling problem
8.4. Where H1 is rejected and where it is partially confirmed
8.5. Alternative interpretations and robustness checks - Integrating the Evidence: Causal Channels and Interactions
9.1. Ranking the main drivers of Spain’s labour‑market gap
9.2. Interactions between fiscal/administrative barriers and structural factors
9.3. Sustainable development lens (SDG 8 and Spain’s 2030 Strategy) - Policy Recommendations
10.1. Core structural agenda
10.2. Targeted fiscal and administrative reforms for self‑employment and SMEs
10.3. Governance, sequencing and EU dimension
10.4. Role of NGOs and social partners - Conclusions
- References
- Annexes (data tables, methodological notes)
3. Methodology and analytical framework
3.1. Research questions and hypotheses
The report is organized around three main research questions:
- How does Spain’s labour‑market performance compare to that of major EU economies—in terms of employment, unemployment, job quality and social inclusion—once cyclical factors are controlled for?
- Which structural factors best explain Spain’s persistent gaps, and how important is the role of the fiscal and administrative regime for self‑employment and micro‑enterprises relative to other determinants?
- What combination of structural, fiscal and administrative reforms is most consistent with sustainable development goals, particularly SDG 8 (decent work and economic growth), in the Spanish context?
From these questions, we derive two explicit hypotheses:
- H1 (fiscal‑administrative barrier hypothesis): Spain’s relatively high fixed social contributions for the self‑employed, the absence of a general VAT registration/exemption threshold, and comparatively burdensome procedures for business start‑up constitute a structural difference vis‑à‑vis many EU peers, which depresses formal self‑employment and SME creation and thereby worsens labour‑market outcomes.
- H0 (null / alternative hypothesis): while such barriers exist, their quantitative impact is modest compared with that of the productive model, firm size distribution, skills and labour‑market institutions, so that they do not explain lower aggregate self‑employment or firm‑birth rates; their main effect is on the composition, formality and scaling capacity of the self‑employment and micro‑enterprise sector.
The empirical strategy is explicitly hypothesis‑driven: instead of merely describing “what the data say”, we test the observable implications of H1 against cross‑country evidence and then integrate the results back into a broader structural framework.
3.2. Comparative scope and country selection
The comparative scope focuses on Spain and five EU peers:
- France, Germany and Italy, as large continental economies with comparable income levels and shared euro‑area constraints but different institutional configurations;
- Portugal and Ireland, as smaller economies with which Spain shares regional dynamics, but which have followed different paths in terms of structural reforms, taxation and specialization.
These countries provide a meaningful variation in:
- labour‑market outcomes (from high‑performing Germany/Ireland to structurally weaker Italy);
- tax wedges and social‑security regimes;
- business demography and SME structures;
- welfare‑state and activation models.
The goal is not to exhaustively benchmark Spain against all EU‑27 members, but to place it within a representative subset of major and relevant peers.
3.3. Data sources and indicators
The analysis draws primarily on official and high‑quality sources:
- Eurostat: Labour Force Survey (employment, unemployment, youth and long‑term unemployment, part‑time, temporary work), labour costs, business demography (enterprise births, deaths, survival, number of active enterprises), regional labour‑market indicators.
- OECD: Employment Outlook, Taxing Wages, indicators of employment protection, public spending on labour‑market policies, productivity and business dynamics; and country notes on Spain.
- Banco de España: annual reports and analytical documents on the Spanish labour market, self‑employment and firm‑level productivity dynamics.
- Government of Spain – España 2050 and Spain’s 2030 Sustainable Development Strategy: long‑term structural diagnostics on the Spanish labour market and its link to sustainable development goals.
- NGO and academic sources: FOESSA/Cáritas on social exclusion and in‑work poverty; Oxfam and academic research on precarious work, duality and entrepreneurship.
- World Bank and related databases: Doing Business indicators and Enterprise Surveys for information on business‑registration procedures and perceived regulatory barriers.
Key indicators include: employment and unemployment rates (total, youth, long‑term), share of temporary and part‑time work, in‑work poverty, self‑employment share, enterprise birth and death rates, number of active enterprises by size class, labour tax wedge, average hourly labour costs, and EPL and ALMP spending indicators.
3.4. Limitations and caveats
Several methodological caveats are important:
- Correlation vs. causation: Cross‑country comparisons primarily identify associations; causal interpretations rely on triangulation with longitudinal evidence and existing econometric studies. The report is careful not to attribute simple “causal primacy” to single variables when the literature indicates complex interactions.
- Measurement differences: While Eurostat and OECD harmonize definitions, some indicators (e.g. self‑employment, micro‑enterprises, in‑work poverty) remain sensitive to national legal definitions and survey design. Results are interpreted in terms of orders of magnitude and patterns rather than precise point estimates.
- Heterogeneity within countries: Regional disparities within Spain and some peers (notably Italy) are large; national averages can mask substantial within‑country differences. The report incorporates regional evidence for Spain but does not provide a full multi‑regional econometric model.
- Scope of the fiscal‑administrative hypothesis: The analysis of barriers to self‑employment and micro‑entrepreneurship is constrained by available cross‑country data; in particular, harmonized micro‑data on very small business behaviour under different VAT and social‑security regimes are limited. The report therefore combines quantitative evidence with institutional and qualitative assessments.
Despite these limitations, the combination of multiple data sources, explicit hypotheses and cross‑validation with the academic and policy literature supports robust, policy‑relevant conclusions.
4. Spain in the European labour market: stylized facts
4.1 Core labour‑market outcomes: employment, unemployment, slack
In aggregate terms, Spain is not an outlier in employment levels, but it is a clear outlier in unemployment. Eurostat data for 2024 show that Spain’s employment rate for people aged 20–64 stands at around 71–72%, below the EU‑27 average of 75.8% and well below Germany (81.3%) and the Netherlands (83.5%), although above Italy (67.1%). This implies that Spain has narrowed the employment gap with the EU since the euro‑crisis years, but has not yet converged to the performance of core northern and central European economies.
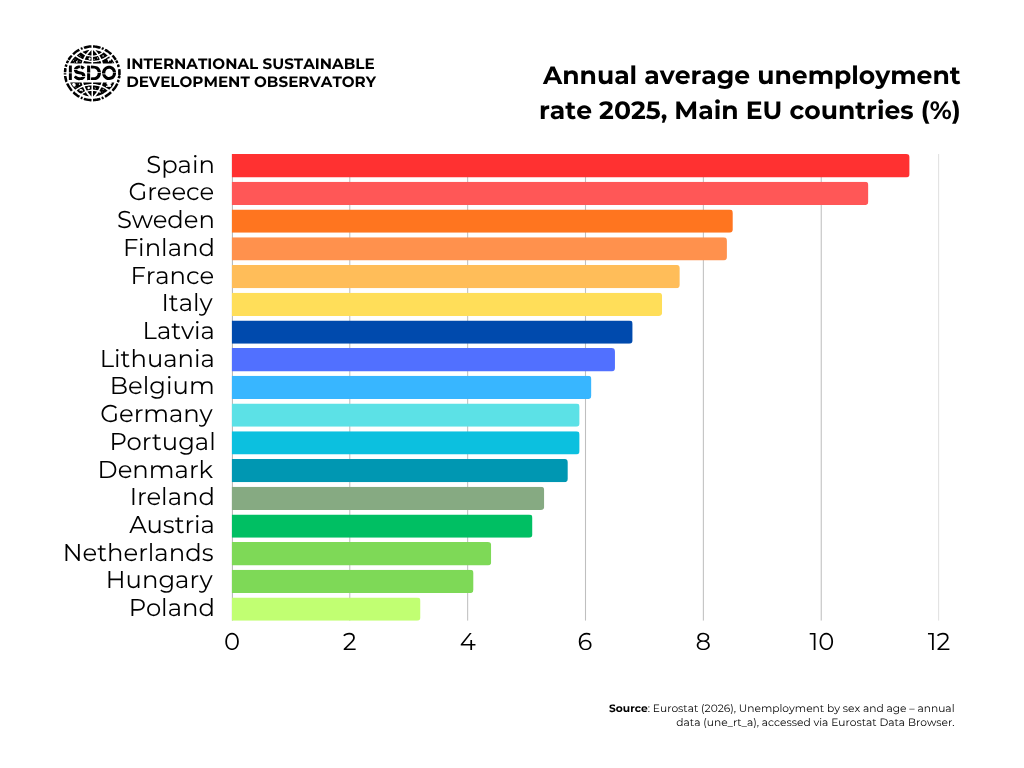
On unemployment, however, Spain remains a clear European outlier. In late 2024 Spain recorded an unemployment rate of about 11–11.5%, almost double the EU‑27 average of 5.9% and far above Germany (around 3%) or Ireland (about 4%). This pattern is not a one‑off: Spain has been among the countries with the highest unemployment in the EU for most of the last three decades, with short periods of convergence followed by sharp divergence during and after crises.
Labour‑market slack—under‑employment, discouraged workers and others marginally attached to the labour force—reinforces this picture. Both OECD and Eurostat indicators show that beyond headline unemployment, Spain has a relatively high share of people available for work but not fully integrated into employment, signalling an under‑utilisation of labour that is larger than what raw unemployment rates alone suggest.
4.2 Youth and long‑term unemployment
The youth dimension magnifies Spain’s divergence. Youth unemployment (typically measured for ages 15–24 or 15–29) is systematically among the highest in the EU. Recent Eurostat‑based compilations put Spain’s youth unemployment rate in the mid‑20s percent range, similar to Italy and well above the EU average of around 11–15%, with Germany below 7%. At regional level, the Spanish autonomous cities of Ceuta and Melilla have youth unemployment rates above 40%, among the very worst in the union.
Long‑term unemployment is likewise structurally high. Eurostat regional data show that several Spanish regions, including Ceuta (28.4%), Melilla (21.6%) and Andalusia (19.0%), had the highest unemployment rates in the EU in 2022, with a large share of the unemployed being without work for more than a year. National estimates suggest that around 4–5% of the labour force in Spain is long‑term unemployed, roughly twice the EU average, and that long‑term joblessness accounts for a very large share of total unemployment.
These facts matter for two reasons. First, they indicate that Spain’s unemployment problem is persistent rather than purely cyclical: many workers remain detached from employment for very long periods, with scarring effects on skills and earnings. Second, they point to structural weaknesses in school‑to‑work transitions, active labour‑market policies and regional labour‑market institutions, rather than just insufficient aggregate demand.
4.3 Job quality: temporary work, part‑time and in‑work poverty
Spain’s labour market does not only differ in terms of quantities; it also differs in the quality and stability of jobs. Historically, Spain has recorded one of the highest rates of temporary employment in the EU: before the 2021–2022 reform, roughly one in four employees held a fixed‑term contract, and more than half of young employees were temporary, compared with an EU average of around 14%. This heavy reliance on temporary contracts made employment highly pro‑cyclical and undermined long‑term skill accumulation.
The recent labour‑market reform has significantly reduced the share of temporary contracts, bringing it closer to the EU average, but early evidence from Banco de España and other sources suggests that a non‑negligible share of the new “permanent” contracts are very short‑lived, which limits the improvement in effective job stability. In this sense, Spain is in the middle of a transition away from extreme duality in contract types, but has not yet fully overcome its legacy of precariousness.
Part‑time work is less frequent in Spain than in core northern European countries, but it is more often involuntary and associated with low wages. Eurostat data show that in many years more than half of Spanish part‑timers report “could not find a full‑time job” as the main reason for part‑time work, whereas in countries like the Netherlands or Germany part‑time work is more often voluntary. This pattern contributes to under‑employment and to a high incidence of in‑work poverty.
On in‑work poverty, Eurostat and national data confirm that Spain is above the EU average. Recent figures place the in‑work at‑risk‑of‑poverty rate for Spain around 11–12%, compared with EU values around 8–9%; this means that a sizeable share of workers live in households with income below 60% of median equivalised disposable income despite being employed. FOESSA’s micro‑level analyses show that in‑work poverty is especially concentrated among households with children, migrants and workers with unstable, low‑paid jobs, often in services.
| Country | Temp. Jobs (%) | Part-Time (%) | In-Work Poverty (%) |
|---|---|---|---|
| Spain | 25.0 etuc | 12.5 etuc | 12.5 eurodiaconia |
| Netherlands | 20.0 etuc | 43.0 etuc | 4.5 eurodiaconia |
| Greece | 15.0 etuc | 10.0 etuc | 14.0 eurodiaconia |
| Poland | 5.0 etuc | 5.0 etuc | 4.0 eurodiaconia |
| Czechia | 8.0 etuc | 5.5 etuc | 3.1 eurodiaconia |
| EU Average | 11.0 etuc | 17.9 etuc | 8.3 eurodiaconia |
4.4 Regional and social inequalities
Spain’s labour‑market performance is marked by very large regional disparities. As already noted, in 2022 Ceuta (28.4%), Melilla (21.6%) and Andalusia (19.0%) registered the highest regional unemployment rates in the EU, while all Spanish NUTS‑2 regions posted unemployment rates equal to or above 9%, well above the EU average of 6.2%. More recent Eurostat “Regions in Europe” updates confirm that Ceuta, Melilla, Andalusia and Extremadura remain among the regions with the highest unemployment in 2024. In contrast, some Spanish regions—particularly in the north and east—exhibit unemployment rates closer to, though still above, the EU average, underscoring the internal heterogeneity of the Spanish labour market.
Socially, the burden of unemployment, precarious work and in‑work poverty is highly uneven. Eurostat shows that unemployed people in the EU face a risk of poverty or social exclusion above 60%, and this risk is even higher in Southern European countries with weaker social protection and more fragmented labour markets. FOESSA’s IX report finds that in Spain severe social exclusion in 2024 remained more than 50% above pre‑crisis levels, and that nearly half of households in moderate or severe exclusion have at least one employed member, illustrating how labour‑market participation no longer guarantees social integration.
These stylized facts provide the empirical backdrop for the rest of the report. They imply that any explanation of Spain’s labour‑market anomaly—and any credible reform agenda—must go beyond cyclical narratives and simple “high taxes” stories and grapple with a combination of structural production‑side factors, institutional design, and territorial and social inequalities. In the next sections we unpack these determinants and then re‑examine, in that light, the specific hypothesis about fiscal and administrative barriers to self‑employment and micro‑entrepreneurship.
5. Structural determinants beyond taxation
5.1 Productive model and firm size distribution
Spain’s labour‑market anomaly cannot be understood without its productive structure. The Spanish economy is structurally biased towards construction, tourism and other low‑productivity services, and under‑weighted in high‑tech manufacturing and knowledge‑intensive services compared with core EU peers. This composition matters because these sectors tend to generate more seasonal, lower‑paid and less stable jobs, amplifying cyclical swings in employment and limiting opportunities for high‑quality work.
Firm size is a central piece of this puzzle. Spain’s business fabric is highly fragmented, with an unusually large share of micro‑enterprises and a relative scarcity of medium‑sized firms. According to CaixaBank Research and OECD data, around 93% of Spanish firms have fewer than 10 employees, compared with about 83% in Germany, and SMEs account for nearly 80% of employment, versus about 60% in Germany. Micro‑enterprises are systematically less productive than larger firms, and Spanish micro and small firms are somewhat less productive than their size‑equivalents in benchmark countries.
Decomposition exercises show that a substantial fraction—up to three‑quarters—of the productivity gap between Spain and Germany can be attributed to this size composition effect: if Spain had the same distribution of employment across firm sizes as Germany, its average labour productivity would be close to German levels, holding within‑size productivity constant. This implies that Spain’s labour‑market weaknesses are not primarily about individual workers “being less productive”, but about the ecosystem in which they work: a long tail of small, low‑productivity firms in low‑value‑added sectors.
For employment, this structure means that job creation tends to occur in firms with limited internal career ladders, weaker training capacities and more volatile demand. It also implies that even when aggregate productivity improves—as has occurred since 2022—gains can be unevenly distributed and may not quickly translate into broad‑based wage growth.
5.2 Human capital, skill mismatches and NEETs
Spain’s human‑capital profile is polarised. On the one hand, tertiary attainment has increased significantly over recent decades; on the other, a large share of adults still lack upper‑secondary education. Spain 2050 reports that almost one‑third of the working‑age population does not have upper‑secondary qualifications, compared with around 17% in the EU. This low‑skilled segment is disproportionately exposed to unemployment, long‑term joblessness and low‑quality jobs.
At the same time, there is a shortage of intermediate vocational skills, particularly in technical, industrial and digital occupations. Several studies and policy reports note that Spain’s vocational education and training (VET) system—despite recent reforms—remains under‑developed compared with dual systems in countries like Germany or Austria, with limited employer involvement and insufficient work‑based learning opportunities. This results in simultaneous reports of labour shortages in some occupations and high unemployment in others, a classic symptom of structural mismatch.
The NEET (Not in Employment, Education or Training) rate offers a synthetic indicator of this problem. Spain has consistently recorded NEET rates above the EU average, especially among young people with low education levels. This implies that a significant share of youth is neither accumulating work experience nor improving their skills, which contributes to the very high rates of youth unemployment and long‑term exclusion documented in section 4.
Over‑qualification is the mirror image at the top end. A substantial proportion of young university graduates in Spain work in jobs below their formal qualification levels, more than in many EU peers. This not only represents a waste of human capital but also exerts downward pressure on wages and opportunities for less‑educated workers, further segmenting the labour market.
5.3 Labour‑market institutions and duality
Spain’s labour‑market institutions have historically combined strong protection for permanent contracts with periods of extensive deregulation for temporary contracts, producing a dual structure with “good” insider jobs and “bad” outsider jobs. Temporary contracts have been heavily used as an adjustment margin: during expansions, firms hire extensively on temporary terms; during downturns, they adjust mainly by not renewing these contracts. This pattern generates large swings in employment and unemployment and creates a “revolving door” between temporary work and joblessness.
Empirical work by Funcas, Banco de España and others estimates Spain’s structural unemployment(NAIRU/NAWRU) at around 15–19%, far above the euro‑area average and well above actual unemployment in many EU peers. This suggests that even with strong growth, unemployment would remain high unless underlying institutional and structural issues are addressed.
From the firm side, recent work using Spanish balance‑sheet data shows that the use of temporary contracts is highly heterogeneous across firms, with a strongly right‑skewed distribution: many firms use very few temporary contracts, while a smaller group relies heavily on them. This heterogeneity persists even controlling for sector, region and cycle, indicating that duality reflects firm‑level strategies and incentives as much as sectoral composition.
Labour‑market reforms in 2010, 2012 and especially 2021–2022 have sought to reduce this duality, first by increasing internal flexibility in permanent contracts and later by restricting the legal use of temporary contracts and promoting new open‑ended modalities such as fixed‑discontinuous contracts. Early evidence indicates that the share of temporary contracts has fallen significantly, but the quality of some new permanent contracts and the extent to which duality has simply migrated to other margins (subcontracting, platform work) remain open questions.
5.4 Territorial fragmentation and social exclusion
Territorial inequalities are another structural determinant. As shown in section 4, Spain and Italy stand out in the EU for their wide regional disparities in unemployment and job quality. Regions such as Ceuta, Melilla, Andalusia and Extremadura systematically record much higher unemployment, long‑term unemployment and employment‑exclusion indices than northern and central regions like Madrid, the Basque Country or Catalonia.
These territorial gaps are closely linked to differences in industrial structure, educational outcomes, infrastructure, institutional capacity and social capital. Regions with weaker diversification, lower average education and more limited active‑labour‑market policies tend to be trapped in high‑unemployment equilibria, where households combine low employment intensity with low wages and poor access to services.
Social exclusion, as documented by FOESSA, has a strong labour‑market component: exclusion indicators are particularly high among households where employment is either absent or predominantly precarious, and among specific groups such as migrants, young adults and single‑parent families. The rise of a “precariat”, as some authors describe it, reflects not only the spread of temporary and low‑paid work but also the insufficiency of social‑protection and activation systems to stabilise trajectories.
From a sustainable‑development perspective, these territorial and social divides imply that national‑level averages underestimate the depth of the problem in certain communities and that labour‑market policy must be integrated with regional development, housing and social‑policy agendas.
5.5 Interim conclusion: the four structural pillars
Taken together, the evidence supports a clear narrative about the structural roots of Spain’s labour‑market under‑performance:
- Productive model and firm size: a long tail of small, low‑productivity firms in low‑value‑added sectors severely limits the creation of stable, high‑quality jobs. This is the single most powerful accounting explanation for Spain’s productivity and employment gap with countries like Germany.
- Human capital and skill mismatches: a large low‑skilled segment, shortages of intermediate vocational skills and widespread over‑qualification undermine both productivity and inclusion, feeding high unemployment and under‑employment.
- Labour‑market institutions and duality: decades of reforms that flexibilised the margin (temporary contracts) more than the core (permanent contracts) created a dual system that generates structural unemployment, high volatility and precarious trajectories, especially for the young and vulnerable.
- Territorial and social fragmentation: large regional unemployment gaps and high levels of in‑work poverty and exclusion concentrate disadvantages in specific regions and groups, weakening the integrative function of employment.
These four pillars account for most of the distance between Spain’s labour‑market outcomes and those of its peers. Importantly for the purposes of this report, they also constitute the baseline against which the fiscal‑administrative hypothesis must be evaluated: any claim that Spain’s distinctive features in taxation and bureaucracy are “key” drivers of its poor labour‑market performance must show incremental explanatory power over and above these already well‑documented structural determinants.
6. The conventional view on taxes and business climate
| Country | Tax Wedge (%) | vs OECD Avg (34.9%) |
|---|---|---|
| Belgium | 52.6 instagram | +17.7 pts |
| Germany | 47.9 instagram | +13.0 pts |
| France | 47.2 instagram | +12.3 pts |
| Austria | 47.0 oecd | +12.1 pts |
| Italy | 46.0 oecd | +11.1 pts |
| Sweden | 42.4 linkedin | +7.5 pts |
| Finland | 43.1 linkedin | +8.2 pts |
| Spain | 39.5 oecd | +4.6 pts |
| Portugal | 41.9 linkedin | +7.0 pts |
| Netherlands | 36.5 oecd | +1.6 pts |
| Poland | 35.0 oecd | +0.1 pts |
| Ireland | 28.0 oecd | -6.9 pts |
| EU Avg | ~42.0 europa | +7.1 pts |
6.1 The labour tax wedge in comparative perspective
The labour tax wedge—personal income tax plus employee and employer social‑security contributions, net of cash benefits, as a share of total labour costs—is often invoked to explain differences in employment performance across OECD and EU countries. In popular and some policy discourse, Spain is frequently portrayed as suffering from “excessive taxes on labour” that would discourage hiring and contribute to high unemployment.
OECD Taxing Wages data do not support this narrative. For a single worker without children earning the average wage, Spain’s tax wedge lies around the OECD average and below that of Germany, France and Italy, which record wedges above 45–47%. For one‑earner couples with children, Spain’s tax wedge is again in the middle of the EU distribution, not among the highest. This pattern is robust to different years and household types: while Spain is not a low‑tax country on labour, it is clearly not in the group of top‑burden countries either.
At the same time, the countries with the highest tax wedges in Europe—such as Belgium, Germany, France and Austria—display better employment and unemployment outcomes than Spain: higher employment rates and significantly lower unemployment. This simple cross‑country observation already weakens any explanation of Spain’s labour‑market problems that relies primarily on “tax wedge too high” arguments.
6.2 Labour costs and competitiveness
A related claim is that high labour costs reduce competitiveness and thereby depress employment. Eurostat’s data on average hourly labour costs, however, show that Spain’s labour costs are below the EU‑27 and euro‑area averages and substantially below those of Germany and France. Non‑wage labour costs (employer contributions) in Spain are close to the EU mean and not among the outliers at the top of the distribution.
This combination—moderate tax wedge, below‑average labour costs and above‑average unemployment—has two implications. First, there is little evidence that Spain is “priced out” of labour‑intensive activities by its wage and tax structures. Second, the problem is more likely related to low productivity and sectoral specialisation than to labour being “too expensive”. In other words, Spain’s difficulty is not predominantly that firms cannot afford to hire, but that too many firms operate in low‑value‑added segments where even low wages do not generate high productivity jobs.
6.3 General business environment indicators
Beyond taxation and labour costs, the general business environment—regulation, bureaucracy, contract enforcement—also influences employment and investment decisions. World Bank Doing Business 2020 profiles place Spain around 30th globally in overall ease of doing business, behind the best‑performing OECD economies but well within the group of advanced countries. In the specific area of “Starting a Business”, Spain requires more procedures and slightly more time than the OECD high‑income average, but with lower monetary costs and no onerous minimum capital requirements.
Enterprise Surveys for Spain show that a non‑negligible share of firms identify tax administration, business licensing and permits, and labour regulations as obstacles to their operations, but these are rarely cited as the single most important constraint; issues such as demand uncertainty, access to finance and competition also feature prominently. Compared with many emerging economies, Spain’s business environment is clearly more predictable and rules‑based; compared with the best EU performers, it is somewhat more bureaucratic and slower but not radically different.
In sum, while there is room for improvement in Spain’s business environment—particularly in terms of regulatory complexity and judicial delays—it does not stand out as an extreme case of hostile regulation in the European context. The “Spain is uniquely over‑regulated and over‑taxed” narrative is not borne out by comparative indicators.
6.4 Why a “high taxes” explanation fails for Spain
Taken together, the evidence in this section points to a clear conclusion: the conventional “high taxes and rigid regulations” story is insufficient and, in some respects, misleading as an explanation for Spain’s labour‑market under‑performance.
Three arguments underpin this assessment:
- Tax wedges and labour costs do not line up with outcomes. Spain has a labour tax wedge and average labour costs that are moderate by EU standards and lower than in several countries with much better employment performance, notably Germany and France. If high taxes and labour costs were the primary drivers of high unemployment, we would expect those countries, not Spain, to be the outliers.
- Business environment indicators show weaknesses, not exceptional hostility. Spain performs somewhat below the best‑practice OECD countries on ease‑of‑doing‑business metrics, but well within the range of advanced economies and not as an outlier. Many peers with comparable or even worse regulatory scores manage to achieve significantly better labour‑market outcomes, suggesting that regulation per se is not the decisive factor.
- Structural and institutional factors explain more. As section 5 showed, the combination of a low‑productivity, service‑biased model; a firm‑size distribution dominated by micro‑firms; a polarised skills structure; and a dual labour‑market regime provides a far more compelling explanation of Spain’s persistent unemployment and precariousness. These factors are consistent with both cross‑country evidence and firm‑level and worker‑level studies; taxation and business‑climate variables add nuance but do not overturn the core structural story.
This does not mean that tax and regulatory reforms are irrelevant. On the contrary, they can play an important role in enabling structural change, especially when targeted at key margins such as self‑employment and micro‑entrepreneurship. But the evidence suggests that blaming “high taxes” in general obscures more than it clarifies: Spain’s problem is not that it taxes labour much more heavily than its peers, but that it combines a mediocre fiscal‑administrative design at the bottom of the system with a weak productive and institutional structure.
7. Hypothesis: fiscal and administrative barriers to self‑employment and micro‑entrepreneurship
7.1 Formulating H1 and H0
The empirical and theoretical discussion so far suggests that Spain’s labour‑market under‑performance is largely driven by structural features of its productive system, skills base, labour‑market institutions and territorial and social inequalities. Against this backdrop, the report formulates a specific, testable hypothesis concerning fiscal and administrative entry barriers at the bottom of the system.
Hypothesis H1 (fiscal‑administrative barrier hypothesis)
Spain’s institutional design for the self‑employed and micro‑enterprises—combining relatively high fixed social‑security contributions for autónomos, the absence (to date) of a general VAT registration/exemption threshold, and comparatively burdensome start‑up and registration procedures—constitutes a structural difference vis‑à‑vis many EU peers. This configuration:
- raises the fixed cost of formal self‑employment and very small business activity;
- discourages low‑turnover and low‑income individuals from experimenting with formal entrepreneurship;
- channels part of economic activity into informality or dependent self‑employment; and
- ultimately depresses the creation and scaling of productive SMEs, thereby worsening labour‑market outcomes and productivity.
In its strong form, H1 implies that these barriers should translate into lower aggregate self‑employment rates, fewer micro‑enterprises and weaker business dynamism in Spain compared with countries with more favourable regimes.
Null / alternative hypothesis H0
While Spain’s fiscal and administrative regime for the self‑employed and micro‑firms differs from that of many EU peers and plausibly affects incentives at the margin, the quantitative impact of these differences is modest compared with that of the four structural pillars identified in section 5. Under H0:
- Spain’s aggregate self‑employment and micro‑enterprise indicators are not systematically worse than those of comparable EU countries;
- the main effect of fiscal and administrative barriers is on the composition, formality and scaling capacity of self‑employment and micro‑enterprises, rather than on their sheer number; and
- labour‑market under‑performance would persist even if these barriers were fully removed, unless deeper structural reforms were undertaken.
The next subsections specify Spain’s institutional design and the channels through which H1 could plausibly operate, before turning to the empirical test in section 8.
7.2 Spain’s institutional design for the self‑employed and micro‑firms
Spain’s regime for the self‑employed (RETA) and micro‑enterprises is distinctive in three interrelated areas: social‑security contributions, VAT rules and business‑registration procedures.
| Country | Total Tax+SS Burden (%) | Key Components |
|---|---|---|
| Spain | 49% infoautonomos | SS quota (€300+/month min), IRPF (15-47%), VAT 21% quarterly |
| Portugal | 42% | Similar SS + IRPF up to 48%, VAT 23% |
| Italy | 41% | Flat-rate option (5-15%) for new autónomos, SS ~25% base |
| Germany | 30-45% (progressive) getquipu | IRPF 14-45%, no fixed SS quota (income-based), VAT 19% |
| EU Avg | ~40% infoautonomos | Varies by income threshold |
7.2.1 Social‑security contributions for the self‑employed
Until 2022, self‑employed workers in Spain could freely choose their contribution base within broad bounds, and more than 80% opted for the minimum base, resulting in a relatively high fixed monthly contribution independent of actual income. This meant that even self‑employed persons with very low or highly volatile earnings faced a substantial, largely non‑proportional cost of formality.
Since 2023, Spain has introduced a new income‑related contribution system for autónomos, with 15 income brackets that will be phased in fully by 2032. Under this system, contributions are more closely tied to declared net income, but still take the form of monthly payments that, for most freelancers, range between roughly 230 and 500 euros per month in 2024, with an average around 294 euros. For 2025, official projections indicate minimum monthly contributions in a band of approximately 200 to 590 euros depending on income bracket.
There are mitigating measures—such as a reduced “flat rate” (around 80–88 euros per month) for new self‑employed workers during the first year, extendable if income remains below the minimum wage—but these are temporary and conditional. For low‑income or low‑turnover self‑employed workers, even the lower contribution levels (around 200–230 euros per month) represent a significant fixed cost of entry and persistence in the formal system, especially when compared with social‑security regimes in some EU countries that operate with lower minima or more strictly proportional contributions for very low incomes.
In short, despite recent reforms in the right direction, Spain still maintains a relatively high fixed component in self‑employed social‑security contributions, particularly burdensome for micro‑activities and “experimental” ventures.
7.2.2 VAT rules and the absence of a general small‑business exemption
Spain is also unusual in its treatment of VAT (IVA) for small businesses. Currently, Spain does not apply a general VAT registration or exemption threshold: in principle, any self‑employed person or firm making taxable supplies must register and charge VAT from the first euro of turnover, although simplified regimes exist for certain sectors (e.g. the módulos system).
By contrast, most EU member states operate VAT exemption thresholds—often between 20,000 and 85,000 euros of annual turnover—below which small enterprises can be exempted from VAT obligations or benefit from simplified schemes. Directive (EU) 2020/285 updated the EU framework for small‑enterprise VAT regimes, allowing member states to exempt businesses with turnover up to 85,000 euros (and up to 100,000 euros EU‑wide in cross‑border operations) from charging VAT, with the explicit aim of reducing compliance costs for SMEs.
Spain has been slow to transpose and implement this directive. As of early 2026, the European Commission has referred Spain to the Court of Justice of the EU for failing to transpose Directive 2020/285 and related VAT directives by the 31 December 2024 deadline, making Spain the only EU country that has not yet implemented the updated rules on small‑business VAT exemptions. Negotiations between self‑employed organisations and the Tax Agency are ongoing, and proposals exist to introduce a VAT exemption for self‑employed persons and SMEs with annual turnover below 85,000 euros, with only an annual declaration required, but these have not yet been fully enacted domestically.
The practical implication is that, unlike in many EU peers, very small formal activities in Spain must manage full VAT compliance from the outset, including quarterly filings and associated bookkeeping, unless they fall under specific simplified regimes. This adds both administrative burden and cash‑flow constraints for low‑turnover entrepreneurs.
7.2.3 Administrative procedures for starting and registering a business
On the administrative side, World Bank Doing Business 2020 indicators show that starting a limited‑liability company in Spain requires more procedures and slightly more time than the OECD high‑income average, although direct monetary costs are relatively low and there is no significant minimum capital requirement. Steps typically include obtaining a negative name certificate, notarising the deed of incorporation, registering with the commercial registry, and registering for tax and social security.
Enterprise Surveys and other firm‑level data indicate that a non‑trivial share of Spanish firms identify tax administration, business licensing and permits, and labour regulations as significant obstacles, though they are not always the top perceived constraint. Importantly for micro‑firms and solo self‑employed entrepreneurs, dealing with multiple administrations (Hacienda, Seguridad Social, Registro Mercantil, local authorities) can be disproportionately costly in terms of time and complexity relative to the small scale of their operations.
In comparative terms, Spain is not an extreme outlier in business‑registration burdens, but—combined with the contribution and VAT regime—it creates a “thick entry layer” of fixed administrative and fiscal costs that must be faced by anyone wishing to engage in formal self‑employment or micro‑entrepreneurship.
7.3 Expected causal mechanisms
Given this institutional configuration, several plausible causal mechanisms link Spain’s fiscal and administrative regime for self‑employment and micro‑firms to labour‑market and productivity outcomes:
- Deterrence of low‑income formal self‑employment
High fixed social‑security contributions and full VAT compliance from the first euro increase the break‑even point for formal self‑employment. For individuals with low expected turnover—such as young people testing a business idea, women re‑entering the labour market after care periods, or migrants facing credit constraints—the expected net income after contributions and tax compliance may be insufficient to justify formal registration.- Expected effect: fewer very small, low‑turnover activities register formally; some do not start at all, others opt for informality (undeclared work) or dependent self‑employment.
- Selection on who becomes an entrepreneur
Because fixed costs weigh more heavily on low‑income projects, the system tends to favour entrepreneurs with higher starting capital, stronger networks or higher expected turnover, while dissuading those at the margin. This selection bias can reduce the diversity of entrepreneurial initiatives and may exclude precisely those groups that sustainable‑development policies seek to empower (youth at risk, women, migrants, people in disadvantaged regions). - Incentives for informality and dependent self‑employment
When the formal cost of being autónomo is high relative to expected earnings, firms may be more inclined to use informal arrangements or “false self‑employment” to transfer risks and costs onto workers while avoiding parts of the contribution burden themselves.- Mechanism: firms outsource tasks to nominally self‑employed workers who in practice are economically dependent, circumventing some labour‑law protections while leaving workers to bear the fixed costs of contributions and compliance.
- Reduced experimentation and scaling of micro‑firms
In innovative ecosystems, many potential entrepreneurs start with very small, low‑profit projects and experimentbefore scaling successful models. High fixed fiscal and administrative costs compress this experimentation space: only projects that can rapidly clear a relatively high cost floor are viable in formal terms.- Expected effect: fewer micro‑firms progress along the “start‑up → small firm → medium‑sized firm” trajectory; Spain’s already skewed firm‑size distribution becomes more entrenched.
- Interactions with structural weaknesses
These mechanisms do not operate in a vacuum; they interact with the four structural pillars identified in section 5. In regions with already weak productive structures and high unemployment, high entry costs into formal entrepreneurship can reinforce low‑employment equilibria and reduce the capacity of local actors to create alternative opportunities. In a dual labour market, they can further segment the boundary between standard employment, self‑employment and informality. - Implications for sustainable development
From a sustainable‑development perspective, these barriers undermine SDG 8 by limiting the scope for inclusive, decent work through entrepreneurship, particularly for vulnerable groups and in lagging regions. They also complicate the just transition towards greener and more digital local economies, where small and micro‑enterprises often play a key role in deploying new technologies and services.
In summary, H1 does not claim that Spain’s fiscal and administrative regime is the primary cause of high unemployment or low productivity; rather, it posits that this regime shapes the margins of self‑employment and micro‑entrepreneurship in ways that may exacerbate existing structural weaknesses. The crucial empirical question, addressed in section 8, is whether these mechanisms are strong enough to produce observable differences in self‑employment rates, business demography and firm dynamics compared with Spain’s EU peers—and, if not, in what sense a weaker, compositional version of the hypothesis still holds.
8. Testing the hypothesis: evidence on self‑employment, business demography and productivity
8.1 Self‑employment rates: Spain vs. EU peers
A strong version of H1 predicts that Spain’s fiscal and administrative regime for self‑employed workers should depress aggregate self‑employment relative to comparable EU countries. The first test is therefore straightforward: how does Spain’s self‑employment share compare in practice?
Eurostat‑based indicators (as compiled by CEDEFOP and other sources) show that the EU‑27 self‑employment rate has fluctuated around 13–15% of total employment in the last decade. Country‑level data indicate that:
- Italy, Greece and some Central‑Eastern European countries tend to have higher self‑employment shares, often above 18–20%;
- Germany, France and many Nordic countries show lower self‑employment shares, often in the 9–12% range;
- Spain sits slightly above the EU average, with self‑employment around 15–16% of total employment, higher than in France and Germany and similar to or slightly above Portugal and Ireland, though below Italy and Greece.
Banco de España’s own analysis of self‑employment in Spain from a European perspective broadly confirms this picture: Spain is not an outlier with exceptionally low self‑employment, but a country with somewhat higher than average self‑employment, concentrated in traditional sectors and with a high share of solo self‑employed.
In other words, the data do not support the claim that Spain’s entry barriers have resulted in under‑self‑employment at the aggregate level. H1, in its strong form (“Spain has fewer self‑employed because of higher fixed costs”), is therefore rejected.
8.2 Business demography: enterprise births, deaths and survival
The second implication of H1 is that Spain should have weaker business demography: lower enterprise‑birth rates and/or a smaller stock of active enterprises than peers.
Eurostat’s business demography statistics for 2022–2023 show that the EU’s business economy comprised over 32–33 million active enterprises, with enterprise birth rates around 10.5–11% and death rates around 8.5%. Within this landscape:
- France and Italy host the largest populations of active enterprises (around 5.2–5.3 and 4.6 million, respectively), followed by Spain with about 3.5 million active enterprises and Germany with roughly 3.2 million.
- According to Spain’s National Statistical Institute (INE), in 2023 Spain had 3,503,285 economically active enterprises, of which 319,085 were created and 273,451 disappeared, implying a birth rate of 9.1%, a death rate of 7.8% and a positive net rate of 1.3%.
- Eurostat’s EU‑wide comparison shows that Spain’s enterprise‑birth rate is slightly below the EU average(10.5%), but well above the lowest‑birth countries (Austria 6.2%, Italy 7.8%) and clearly not among the laggards; it lies in a middle‑to‑upper range, with countries like Portugal posting higher birth rates (16.8%).
Crucially, Spain is not in the group of EU countries where enterprise death rates exceed birth rates; in most recent years, more businesses have opened than dissolved in Spain, leading to a positive net balance. The stock of active enterprises is large in absolute terms and similar in scale to that of Italy and Germany once population is taken into account.
Furthermore, Spanish business demography is heavily skewed towards micro‑enterprises: in 2023, 98.6% of enterprise births and 98.3% of deaths involved firms with four or fewer employees, and 76.1% of new enterprises had no employees. This is consistent with a business structure dominated by self‑employed and very small firms rather than an absence of such actors.
Again, the data do not support the idea that Spain suffers from a quantitative deficit of business creation attributable to its fiscal and administrative regime. H1’s prediction of lower enterprise‑birth rates and fewer micro‑firms relative to the EU is not borne out by the evidence.
8.3 Firm dynamics and the scaling problem
Where Spain does exhibit a distinctive pattern is in firm dynamics and scaling. IMF, Banco de España, JRC and CaixaBank studies find that Spanish firms tend to grow less in size over their life cycle than comparable firms in other EU countries, resulting in a deficit of medium‑sized, high‑productivity enterprises.
Enterprise‑birth data show that the vast majority of new Spanish firms are born as non‑employer enterprises (no employees) or with 1–4 employees, and that survival rates at five years (about 41.9% for firms born in 2018) are broadly comparable to EU norms. However, transitions from micro‑ to small‑ and medium‑sized status are relatively rare:
- High‑growth enterprises (firms with at least 10 employees and annual employment growth above 10% over three years) represent a modest share of the Spanish business population and contribute less to overall employment growth than in some peer countries.
- Firm‑level productivity analyses show that a large number of Spanish firms operate persistently at low productivity levels, and that resource reallocation towards more productive firms is weaker than in more dynamic economies.
This pattern is consistent with the idea that Spain has many micro‑firms, but relatively few that scale up. From the perspective of H1, this opens a more nuanced question: could high fixed fiscal and administrative costs for self‑employed and micro‑firms be one of the factors that limit experimentation and scaling, even if they do not reduce the number of firms born?
The evidence here is suggestive but not conclusive. There is no cross‑country econometric study that isolates the impact of self‑employed contribution minima or VAT thresholds on firm‑growth trajectories in Spain versus peers. However, the combination of:
- a firm‑size distribution skewed towards micro‑enterprises;
- a fiscal‑administrative regime with relatively high fixed costs at very small scales; and
- weaker observed scaling into medium‑sized firms
is at least compatible with the mechanism outlined in section 7, where high fixed costs compress the experimentation space and raise the bar for viable growth.
8.4 Where H1 is rejected and where it is partially confirmed
On the basis of the evidence reviewed, the hypothesis H1 can be evaluated along three dimensions.
- Aggregate self‑employment (H1a)
- Prediction: Spain should have significantly lower self‑employment rates than comparable EU countries.
- Evidence: Spain’s self‑employment share is slightly above the EU average and higher than in France, Germany or Ireland, though below Italy and Greece.
- Assessment: H1a is rejected. Spain does not exhibit under‑self‑employment in aggregate.
- Business creation and micro‑firm prevalence (H1b)
- Prediction: Spain should have lower enterprise‑birth rates and fewer micro‑firms than peers.
- Evidence: Spain has around 3.5 million active enterprises, third in the EU, with a birth rate of 9.1% and a large dominance of micro‑enterprises; it is not among the countries with the lowest birth rates, and more firms are created than dissolved.
- Assessment: H1b is rejected. Spain does not have an obvious quantitative deficit of micro‑enterprises or firm births.
- Firm dynamics, composition and scaling (H1c)
- Prediction: Spain’s fixed‑cost regime will bias the composition of self‑employment and micro‑firms, push some activity into informality or dependent self‑employment, and hinder scaling into medium‑sized firms.
- Evidence:
- Spain has many self‑employed and micro‑firms, but firm‑level studies show weaker scaling and a deficit of medium‑sized, high‑productivity firms.
- The self‑employment structure is skewed towards low‑productivity sectors and solo self‑employed, with signs of dependent self‑employment and precarious status for some groups.
- Spain’s fiscal and administrative regime does impose relatively high fixed costs on low‑income self‑employed and full VAT compliance from the first euro, unlike many EU peers, and Spain has lagged in implementing small‑business VAT exemptions.
- Assessment: H1c cannot be conclusively proven with existing cross‑country econometrics, but is consistent with observed patterns and institutional logic. It is reasonable to accept a weaker, compositional version of H1: fiscal and administrative barriers influence who becomes formally self‑employed, how formal that activity is, and how easily micro‑firms can grow, rather than the aggregate number of self‑employed or firms.
Overall, the strong version of H1—that fiscal and administrative barriers are a key structural reason why Spain has fewer self‑employed and fewer small firms than its peers—is not supported by the data. A moderate version, in which these barriers act as filters and amplifiers of deeper structural problems, is both plausible and consistent with available evidence.
8.5 Alternative interpretations and robustness checks
Given the limitations of cross‑country data, it is important to consider alternative explanations and potential confounders.
First, some of Spain’s relatively high self‑employment may reflect necessity rather than opportunity entrepreneurship: in contexts of high unemployment and weak social protection, individuals may choose self‑employment because they lack better wage‑employment options. In that case, high self‑employment does not imply that entry barriers are low; it may instead indicate that many people are willing to bear high costs to avoid inactivity.
Second, part of Spain’s large micro‑enterprise sector may consist of low‑productivity, low‑survival “survival firms”, which inflate enterprise‑birth statistics without contributing meaningfully to sustainable employment or productivity. The fact that 76.1% of new firms have no employees and that many operate in saturated, low‑margin sectors supports this concern.
Third, cultural and institutional factors—including historical patterns of family business, sectoral specialisation and credit markets—also shape entrepreneurship and self‑employment decisions, independently of tax and administrative rules. It would be incorrect to attribute all observed patterns solely to fiscal‑administrative design.
To address these issues, a fully rigorous test of H1 would require micro‑level panel data on individuals and firms, linked to policy changes in contributions and VAT thresholds and compared across countries. While such a study is beyond the scope of this report, existing micro‑literature on Spain’s dual labour market, entrepreneurship and firm dynamics already supports the broader conclusion reached here: structural and institutional factors explain most of the variation, while fiscal‑administrative design for self‑employment and micro‑firms matters at the margin, especially for the composition and quality of entrepreneurial activity.
9. Integrating the evidence: causal channels and interactions
9.1 Ranking the main drivers of Spain’s labour‑market gap
The evidence assembled in sections 4–8 supports a hierarchy of explanatory factors for Spain’s labour‑market under‑performance relative to core EU peers. In terms of causal weight, the following ordering is most consistent with cross‑country data, firm‑level analyses and the academic literature:
- Productive model and firm size distribution
Spain’s specialisation in low‑productivity services and construction, combined with a business structure heavily dominated by micro‑enterprises and a deficit of medium‑sized firms, is the single most powerful accounting explanation for its productivity and employment gap. A long tail of small, low‑productivity firms in low‑value‑added sectors systematically generates more volatile, lower‑paid and less stable jobs than the diversified, medium‑firm‑rich ecosystems of countries like Germany or the Netherlands. - Human capital and skill mismatches
A polarised skills structure—with a large low‑educated segment, shortages of intermediate vocational skills and high over‑qualification among graduates—contributes to both high unemployment and under‑employment. Skill mismatches are a recurrent theme in evaluations of Spain’s labour market and are seen as a central obstacle to translating job creation into sustained productivity gains and decent work. - Labour‑market institutions and duality
Spain’s history of liberalising temporary contracts while maintaining relatively rigid and litigious dismissal rules for permanent contracts has produced a dual labour market that generates high structural unemployment, large cyclical swings and precarious trajectories for many workers. Even after the 2021–2022 reform, which significantly reduced the formal incidence of temporary contracts, concerns remain about very short‑duration “permanent” contracts and the migration of duality to other margins such as subcontracting and platform work. - Territorial and social fragmentation
Extreme regional disparities in unemployment and job quality (with Ceuta, Melilla and Andalusia consistently at the top of EU unemployment rankings) and high levels of in‑work poverty and social exclusion undermine the integrative power of employment, particularly for youth, migrants and women. These fragmentations interact with the three previous pillars, making structural reform more difficult and uneven. - Fiscal and administrative regime for self‑employment and micro‑firms
Spain’s high fixed social‑security contributions for self‑employed workers, absence (so far) of a general VAT threshold, and multi‑step business‑registration procedures create a “thick entry layer” of fixed costs for very small formal activities. However, the evidence in section 8 shows that these factors do not translate into lower aggregate self‑employment or business‑birth rates; their main role is to shape the composition, formality and scaling capacity of self‑employment and micro‑enterprises rather than their overall number.
This hierarchy implies that any credible causal story must treat fiscal and administrative barriers as second‑order but non‑trivial mechanisms that interact with, rather than replace, the core structural determinants.
9.2 Interactions between fiscal/administrative barriers and structural factors
Although the strong form of H1 is rejected, the weaker, compositional version of the hypothesis becomes more interesting precisely when framed in terms of interactions with the four structural pillars.
- With the productive model and firm size distribution
In an economy already dominated by micro‑enterprises and low‑productivity services, high fixed entry and compliance costs for formal self‑employment and micro‑firms can:- discourage the formalisation of small, potentially innovative activities that start with low turnover;
- reinforce a business landscape where many micro‑firms remain in survival mode and few manage to scale into medium‑sized, high‑productivity enterprises.
This interaction helps explain why Spain has many firms but few that grow, and why the SME sector is central to the productivity challenge highlighted by the OECD.
- With human capital and skill mismatches
For individuals with weak labour‑market attachment—such as early school‑leavers, NEETs or low‑income migrants—self‑employment and micro‑entrepreneurship can be a route to inclusion. However, when the fiscal and administrative cost floor is high, only those with sufficient initial capital or support networks can cross it. This can exclude precisely those groups that SDG 8 and Spain’s 2030 Strategy aim to prioritise (youth, women, people with disabilities, migrants), weakening the potential of entrepreneurship as a tool for inclusive employment. - With labour‑market institutions and duality
In a dual labour market, firms may use self‑employment as a way to externalise risks and costs. If formal self‑employment is expensive, some of this activity moves into informality or takes the shape of dependent self‑employment where workers bear high fixed costs without the autonomy typically associated with entrepreneurship. At the same time, the relatively high fixed social‑security contributions for autónomos can reduce the net advantage of self‑employment over precarious wage employment, limiting the ability of workers to exit duality via genuine entrepreneurship. - With territorial and social fragmentation
In high‑unemployment regions with weak institutional capacity, high fixed costs for formal entrepreneurship can entrench low‑employment equilibria. Local actors may be less able to create and scale formal micro‑enterprises that could diversify the productive base; informal or semi‑formal arrangements become more attractive or necessary, reinforcing patterns of exclusion documented by FOESSA and territorial studies. This undermines the regional convergence and cohesion objectives embedded in both EU and national strategies. - Dynamic perspective: from job quantity to job quality and productivity
Recent OECD work emphasises that Spain’s challenge has shifted from job creation to productivity and job quality: employment is growing faster than in many peers, but productivity per hour worked still lags and too many jobs are low‑quality. In this context, reducing fiscal and administrative barriers for self‑employment and micro‑firms is not about increasing the sheer number of very small firms; it is about allowing more diverse and higher‑productivity entrepreneurial trajectories to emerge and scale, especially in green and digital sectors.
Thus, the interactions perspective suggests that fiscal and administrative reforms, while not sufficient on their own, can play a leveraging role: by lowering the cost floor at the bottom, they can make other structural reforms (in skills, industrial policy, labour institutions) more effective in generating decent work.
9.3 Sustainable development lens: SDG 8 and Spain’s 2030 Strategy
From a sustainable‑development standpoint, the integration of these causal channels must be aligned with the commitments under SDG 8 (Decent work and economic growth) and Spain’s 2030 Sustainable Development Strategy.
SDG 8 calls for sustained, inclusive and sustainable economic growth, full and productive employment and decent work for all, with particular attention to youth, women, migrants and people in precarious employment. Spain’s 2030 Strategy, approved in 2026, identifies as key national challenges the reduction of inequality (including through minimum wage and employment reforms), the creation of 500,000 additional jobs in the care sector, the expansion of dual VET and the increase in employment rates for groups such as people with disabilities and older workers.
In this framework:
- The four structural pillars (productive model, skills, institutions, territorial cohesion) correspond to the “macro‑side” of SDG 8: raising productivity, diversifying the economy, ensuring quality education and training, and strengthening labour rights and social protection.
- The fiscal and administrative regime for self‑employment and micro‑firms corresponds to the “micro‑infrastructure” for SDG 8 target 8.3, which explicitly calls for development‑oriented policies that support productive activities, decent job creation, entrepreneurship and the growth of micro, small and medium‑sized enterprises, including through access to financial services.
Seen through this lens, Spain’s current regime is misaligned with SDG 8 in at least three ways:
- It raises fixed costs disproportionately for low‑income and low‑turnover entrepreneurs, contrary to the spirit of promoting inclusive entrepreneurship and the formalisation of micro‑enterprises.
- It delays the full implementation of EU VAT rules designed to reduce compliance burdens for small businesses, which would directly support SDG 8.3 on promoting MSME growth.
- It limits the capacity of SMEs to drive a green and digital transition, as emphasised by OECD and green‑jobs analyses, by tying a significant part of their scarce resources to compliance rather than innovation and upgrading.
For an NGO working on sustainable development, this integrated analysis has two strategic implications:
- First, advocacy on fiscal and administrative reform for self‑employment and micro‑firms should be framed not as a narrow “tax‑cut” agenda, but as a structural enabling reform that makes it easier for vulnerable groups and territories to generate decent, formal work and for SMEs to scale in ways consistent with SDG 8 and Spain’s 2030 Strategy.
- Second, such reforms must be embedded in a broader policy package that simultaneously addresses the four structural pillars; otherwise, they risk simply increasing the number of low‑productivity survival firms or reinforcing duality.
10. Policy recommendations
10.1 Core structural agenda
Given the ranking of drivers in section 9, the bulk of the policy effort must address the four structural pillars: productive model, skills, labour‑market institutions and territorial/social cohesion.
- Rebalancing the productive model and firm size distribution
- Industrial and cluster policy for medium‑sized firms: orient industrial policy, EU funds (Next Generation EU, cohesion policy) and national development finance (ICO, COFIDES) towards helping micro and small firms scale into medium‑sized, high‑productivity enterprises, especially in green and digital sectors.
- Conditional support: link tax credits, grants and subsidised finance to verifiable commitments on innovation, export orientation, quality employment and training, rather than to mere survival or headcount.
- Reduce “size traps”: review thresholds in regulations (labour, tax, reporting) that increase compliance burdens sharply at specific employment levels (e.g. 10, 50 workers) and redesign them to be more gradual, so firms are not discouraged from growing.
- Closing skills gaps and improving school‑to‑work transitions
- Strengthen upper‑secondary completion: scale up proven interventions to reduce early school leaving, especially in regions with high NEET rates, combining academic support, vocational pathways and targeted income support.
- Transform VET into a true dual system: expand high‑quality dual vocational education with strong employer participation in curriculum design and training provision, focusing on sectors linked to the green and digital transitions.
- Career guidance and lifelong learning: integrate systematic career guidance in secondary education and reinforce adult learning and reskilling programmes, especially for workers in at‑risk sectors (routine services, carbon‑intensive activities).
- Consolidating labour‑market reforms and addressing residual duality
- Evaluate the 2021–2022 reform on effective stability: commission independent evaluations that go beyond contract labels to measure job duration, transitions and wage trajectories, identifying where duality has shifted to subcontracting and platform work.
- Internal flexibility and negotiated adjustment: promote firm‑level and sectoral agreements that favour internal flexibility (working‑time adjustments, functional mobility, ERTE‑type instruments) over external flexibility (layoffs and temporary contracts), building on the positive experience during the pandemic.
- Extend protections to non‑standard workers: clarify the employment status and rights of platform workers and dependent self‑employed, ensuring access to social protection and collective representation.
- Reinforcing active labour‑market policies (ALMPs) and public employment services
- Increase ALMP spending with quality controls: move towards spending levels and programme intensity comparable to high‑performing activation countries, with robust monitoring and impact evaluation.
- Lower caseloads and personalise services: reduce counsellor‑to‑jobseeker ratios in SEPE and regional services to approach best practices (e.g. one counsellor per 80–100 jobseekers), enabling personalised support and integrated service delivery.
- Integrate NGOs and social enterprises: formalise the role of civil‑society organisations and social enterprises in delivering ALMPs for hard‑to‑serve groups, under results‑based contracts and shared data frameworks.
- Tackling in‑work poverty and social exclusion
- Coordinate wage, tax‑benefit and housing policies: embed minimum‑wage policy within a broader strategy that includes in‑work benefits, affordable housing and childcare, to ensure that wage floors translate into genuine poverty reduction rather than only cost pressures.
- Strengthen and simplify minimum income schemes: improve the take‑up and adequacy of the Ingreso Mínimo Vital, aligning it with activation policies and reducing administrative barriers for vulnerable households.
10.2 Targeted fiscal and administrative reforms for self‑employment and SMEs
Within this structural framework, fiscal and administrative reforms for self‑employment and micro‑enterprises should be treated as precision tools to lower the entry and experimentation barrier, especially for vulnerable groups and in lagging regions.
- Make self‑employed contributions truly income‑proportional
- Deepen the income‑based RETA reform at the bottom: reduce the effective fixed component of contributions for the lowest income brackets, bringing the minimum monthly burden closer to a genuinely marginal rate rather than a quasi lump‑sum.
- Introduce a “micro‑activity” tier: create a specific contribution regime for very low‑turnover self‑employment (e.g. below a threshold aligned with the future VAT exemption), with simplified assessment and much lower monthly contributions, conditional on turnover reporting.
- Time‑limited contribution relief tied to evaluation: for new self‑employed with low incomes, extend reduced‑rate periods but embed them in rigorous evaluations of survival, formality and scaling, to distinguish between effective activation tools and mere subsidies.
- Implement an effective VAT threshold and simplified regimes
- Full and ambitious transposition of Directive (EU) 2020/285: introduce a VAT exemption or ultra‑simplified regime for self‑employed persons and SMEs with annual turnover up to at least 85,000 euros, with minimal reporting (e.g. annual summary) and clear rules on transition when the threshold is exceeded.
- Design to minimise cliff effects: structure the threshold and reporting obligations so that crossing it does not result in disproportionate increases in compliance costs, avoiding new size traps around the VAT limit.
- Accompany with information and support: ensure that potential beneficiaries—especially in disadvantaged regions and among vulnerable groups—are proactively informed and supported in understanding and using the new regime.
- Streamline business registration and early‑stage compliance
- Single digital gateway: implement a genuinely integrated “one‑stop shop” for business creation, allowing self‑employed and micro‑firms to register for tax, social security and (where needed) commercial registry through a single digital interface, with standard time limits and pre‑validated templates.
- Early‑stage “light compliance”: for the first two years of operation and below a given turnover threshold, limit reporting to a small set of key obligations and focus inspections on support and guidance rather than sanctions, except in cases of deliberate fraud.
- Simplify local licensing for micro‑activities: review municipal licensing and permit requirements for very small, low‑risk activities, streamlining or waiving certain procedures where risks are minimal.
- Inclusive entrepreneurship programmes for vulnerable groups
- Targeted schemes for youth, women and migrants: combine micro‑finance, mentoring, fiscal incentives (reduced or deferred contributions) and business‑development services, with clear inclusion criteria and strong evaluation.
- Promote collective and social‑economy entrepreneurship: support cooperatives, labour‑managed firms and social enterprises as forms of collective entrepreneurship that can share fixed costs and risks while aligning with SDG 8 and other goals (gender equality, reduced inequalities).
10.3 Governance, sequencing and EU dimension
To avoid reform fatigue and policy incoherence, implementation should follow a sequenced and coordinated approach.
- Sequencing
- Short term (1–3 years):
- Transpose and implement the VAT small‑enterprise regime;
- Adjust self‑employed contributions at the lowest brackets;
- Launch the one‑stop shop for business registration and pilot “light compliance” regimes;
- Scale up ALMPs and strengthen SEPE capacities in high‑unemployment regions.
- Medium term (4–7 years):
- Deepen VET reform and expand dual training;
- Implement industrial and SME‑scaling policies linked to the green and digital transitions;
- Evaluate and refine labour‑market reforms to tackle residual duality and platform work.
- Long term (beyond 7 years):
- Consolidate a diversified, higher‑productivity production structure with a stronger medium‑sized firm segment;
- Embed SDG 8 targets into regular macro‑fiscal and labour‑market surveillance (e.g. within the European Semester).
- Governance and coordination
- Inter‑ministerial coordination: create a formal coordination mechanism between the ministries responsible for labour, social security, finance, industry and territorial policy, with a shared SDG 8 dashboard and clear division of responsibilities.
- Social dialogue and co‑design: use existing tripartite structures (government, unions, employers) to co‑design reforms, but also open structured channels for NGOs and social‑economy actors, especially on issues of entrepreneurship, inclusion and territorial cohesion.
- Data and evaluation: invest in micro‑data infrastructure linking tax, social security, firm‑level and survey data, to enable rigorous evaluation of how fiscal and administrative changes affect self‑employment, firm dynamics and labour‑market outcomes.
- EU dimension
- Align with EU industrial, cohesion and SME policies: leverage EU funding and policy frameworks (e.g. Green Deal Industrial Plan, SME Strategy, ESF+) to support Spain’s structural and micro‑level reforms.
- Engage in peer learning: systematically compare Spain’s reforms and outcomes with those of countries that have successfully combined inclusive labour‑market performance with supportive regimes for micro‑enterprises (e.g. Germany, the Netherlands, some Nordics), using OECD and EU platforms.
10.4 Role of NGOs and social partners
For an NGO specialising in sustainable development and public‑policy counselling, this agenda opens several strategic lines of action:
- Evidence‑based advocacy
- Use the findings of this report to shift the narrative from generic “high taxes” complaints to a more nuanced focus on where fiscal and administrative burdens are excessive (low‑income self‑employed, micro‑enterprises) and how they interact with structural determinants.
- Produce accessible policy briefs and visual materials connecting specific reforms (VAT threshold, RETA redesign, one‑stop shop) with SDG 8 targets and with concrete stories of affected groups.
- Policy design support
- Offer technical assistance to ministries and parliamentary committees in drafting or reviewing legislation on self‑employment, SME taxation and business regulation, bringing in comparative evidence and SDG framing.
- Participate in consultative processes on Spain’s 2030 Strategy updates and on national reform programmes under the European Semester, ensuring that inclusive entrepreneurship and micro‑enterprise issues are represented.
- Pilot projects and demonstration effects
- Co‑design and implement pilot programmes of inclusive entrepreneurship (e.g. for NEET youth, migrant women, long‑term unemployed) that combine reduced fiscal/administrative burdens with mentoring and finance, and rigorously evaluate their impact.
- Use successful pilots to argue for scaling up reforms at national level and to demonstrate that well‑designed reductions in entry costs can foster formalisation and decent work rather than informality.
- Monitoring and accountability
- Develop an independent SDG 8 observatory for Spain, tracking indicators on decent work, self‑employment quality, SME dynamics and regional inequalities, and assessing progress against the integrated reform agenda outlined here.
- Work in coalition with trade unions, employer associations and other NGOs to monitor implementation of VAT and RETA reforms and to flag unintended consequences (e.g. new loopholes, regressivity).
In combination, this structural and micro‑level reform package provides a coherent roadmap for moving Spain closer to the dual objective of European labour‑market convergence and sustainable, inclusive development, positioning your organisation as a credible, technically rigorous interlocutor in debates on fiscal policy, employment and the SDGs.
11. Conclusions
11.1 What the evidence does and does not support
The analysis shows that Spain’s labour‑market under‑performance is not primarily a story of “high taxes” or an exceptionally hostile business environment. Spain’s labour tax wedge and average labour costs are moderate by EU standards and notably lower than in countries such as Germany and France, which enjoy higher employment and lower unemployment. General business‑climate indicators place Spain below best‑practice OECD economies, but not as a European outlier.
Instead, the evidence points to a coherent set of deep structural determinants:
- A productive model skewed towards low‑productivity services and construction, with a business fabric dominated by micro‑enterprises and a shortage of medium‑sized firms, which explains a large share of Spain’s productivity and job‑quality gap with core EU countries.
- A polarised skills structure, with many low‑educated adults, shortages of intermediate vocational skills and widespread over‑qualification among graduates, resulting in structural mismatches and persistently high NEET and unemployment rates.
- A long‑standing dual labour‑market regime that has relied heavily on temporary contracts as an adjustment margin, generating high structural unemployment, volatility and precarious trajectories, only partially corrected by recent reforms.
- Profound territorial and social inequalities, with some Spanish regions and social groups (youth, migrants, women, single‑parent households) facing chronic unemployment, in‑work poverty and social exclusion, limiting the integrative power of employment.
Against this backdrop, the specific fiscal‑administrative regime for self‑employed workers and micro‑firms plays a non‑negligible but clearly second‑order role. Spain’s high fixed social‑security contributions for autónomos, absence (so far) of a broad VAT exemption threshold and multi‑step business‑registration procedures do impose a relatively thick layer of fixed costs at the bottom of the system. However, the strong version of the hypothesis that these features are a key driver of Spain’s labour‑market anomaly is not supported: Spain’s self‑employment share is slightly above the EU average, and its stock of active enterprises and enterprise‑birth rates are not systematically lower than those of comparable EU countries.
11.2 Implications for Spain’s position in the EU and for sustainable development
The weaker, more defensible version of the fiscal‑administrative hypothesis is that Spain’s regime filters and amplifiesunderlying structural weaknesses rather than causing them. By raising fixed costs for very small formal activities and delaying the adoption of EU‑level simplifications such as the VAT small‑enterprise regime, Spain:
- discourages formal low‑turnover entrepreneurship and makes it harder for vulnerable groups—young people, women, migrants—to use self‑employment as a pathway to inclusion;
- pushes part of economic activity towards informality or dependent self‑employment, reinforcing patterns of precariousness and duality;
- and compresses the experimentation and growth space for micro‑firms, contributing, at the margin, to the deficit of medium‑sized, high‑productivity enterprises.
In the context of SDG 8 (Decent work and economic growth) and Spain’s 2030 Sustainable Development Strategy, this configuration is problematic. SDG 8 explicitly calls for development‑oriented policies that promote productive activities, decent job creation, entrepreneurship and the growth of micro, small and medium‑sized enterprises. Spain’s current regime only partially meets this standard: while it ensures relatively stable financing for social security, it places disproportionate burdens on low‑income self‑employed workers and small formal businesses, and it has lagged in implementing EU provisions designed to reduce compliance costs for SMEs.
For Spain’s position in the EU, the implication is twofold. First, without deep reforms in its productive structure, skills system, labour institutions and territorial governance, Spain will continue to combine high employment volatility and structural unemployment with comparatively low productivity, even if headline tax wedges or contribution rates change at the margin. Second, targeted fiscal‑administrative reforms that lower entry and experimentation barriers for self‑employment and micro‑firms can enhance the quality and inclusiveness of entrepreneurship and thus strengthen Spain’s capacity to converge with EU leaders on SDG 8 indicators.
11.3 Open questions and priorities for future research
The report’s findings are robust at a macro and meso level, but they also highlight several open questions that call for further micro‑level and longitudinal research:
- To what extent do changes in self‑employed contribution rules and VAT thresholds affect the formalisation, survival and growth trajectories of individual micro‑enterprises in Spain, particularly in disadvantaged regions?
- How do fiscal and administrative entry costs interact with gender, migration status and age, shaping who becomes an entrepreneur and on what terms, and how do these patterns contribute to or mitigate labour‑market inequalities?
- Which combinations of ALMPs, fiscal incentives and support services are most effective at turning necessity entrepreneurship in high‑unemployment regions into more sustainable, opportunity‑driven ventures aligned with green and digital transitions?
From an academic and NGO perspective, answering these questions will require access to linked administrative and survey micro‑data, careful quasi‑experimental designs around policy changes (e.g. staggered implementation of VAT exemptions or contribution reforms), and close collaboration with public authorities.
Normatively, the main conclusion is clear: Spain’s labour‑market anomaly is primarily structural, but not immutable. A credible strategy for convergence with the best EU performers and for achieving SDG 8 must rest on:
- an ambitious structural reform agenda focused on productivity, education, labour‑market institutions and territorial cohesion; and
- a complementary micro‑level redesign of fiscal and administrative rules governing self‑employment and micro‑enterprises, aimed at lowering unjustified entry barriers, broadening the base of inclusive entrepreneurship and enhancing the capacity of SMEs to drive a just green and digital transition.
12. References
Informes oficiales y organismos internacionales
Banco de España. (2019). Characterisation of self-employment in Spain from a European perspective. Economic Bulletin. https://www.bde.es/f/webbde/SES/Secciones/Publicaciones/InformesBoletinesRevistas/BoletinEconomico/19/T4/Files/be1904-art16e.pdf
Banco de España. (2024). Annual report 2023. Chapter 3: The Spanish labour market. Banco de España. https://www.bde.es/f/webbe/SES/Secciones/Publicaciones/PublicacionesAnuales/InformesAnuales/23/Files/InfAnual_2023_Cap3_En.pdf
European Commission. (2020). Directive (EU) 2020/285 of 18 February 2020 amending Directive 2006/112/EC as regards the special scheme for small enterprises. Official Journal of the European Union, L62, 13–23. https://eur-lex.europa.eu/legal-content/EN/TXT/?uri=CELEX:32020L0285
European Commission. (2024). In-depth review for Spain 2024. Institutional Paper. https://economy-finance.ec.europa.eu/publications/2024-european-semester-country-reports_en
Eurostat. (2021). Employment – annual statistics. Statistics Explained. https://ec.europa.eu/eurostat/statistics-explained/index.php?title=Employment_-_annual_statistics
Eurostat. (2023, May 29). Unemployment rate varied widely across EU regions. Eurostat News. https://ec.europa.eu/eurostat/web/products-eurostat-news/w/ddn-20230530-2
Eurostat. (2024). Labour market – Overview. https://ec.europa.eu/eurostat/web/labour-market
Eurostat. (2024). Business demography statistics. Statistics Explained. https://ec.europa.eu/eurostat/statistics-explained/index.php?title=Business_demography_statistics
Eurostat. (2025). More businesses opened than dissolved in the EU in 2023. Eurostat News. https://ec.europa.eu/eurostat/web/products-eurostat-news/w/ddn-20251013-1
Eurostat. (2025). In-work at-risk-of-poverty rate by type of contract (ilc_iw05). https://ec.europa.eu/eurostat/databrowser/view/ilc_iw05/default/table
International Monetary Fund. (2023). Labor productivity dynamics in Spain: A firm-level perspective (Selected Issues Paper No. 2023/012). IMF. https://www.imf.org/-/media/Files/Publications/Selected-Issues/2023/english/sipea2023012.ashx
International Monetary Fund. (2024). Assessment of the effects of Spain’s 2021 labor market reform (Country Report). IMF. https://www.elibrary.imf.org/view/journals/002/2024/153/article-A003-en.xml
OECD. (2023). Taxing wages 2023. OECD Publishing. https://doi.org/10.1787/3a22fa73-en
OECD. (2024). OECD employment outlook 2024. OECD Publishing. https://doi.org/10.1787/ac8b3538-en
OECD. (2024). OECD employment outlook 2024: Country note – Spain. OECD Publishing. https://www.oecd.org/en/publications/oecd-employment-outlook-2024-country-notes_d6c84475-en/spain_b237abc0-en.html
OECD. (2025). Improving active labour market policies in Spain. OECD Publishing. https://doi.org/10.1787/745e0cdd-en
OECD. (2025). OECD economic surveys: Spain 2025. OECD Publishing. https://doi.org/10.1787/abc5c435-en
World Bank. (2020). Doing business 2020: Comparing business regulation in 190 economies. Economy profile: Spain. World Bank. https://openknowledge.worldbank.org/server/api/core/bitstreams/9d665fbf-328a-5e2f-9b2b-946e2f0a1b5b/content
Fuentes españolas (gobierno y estadística oficial)
Gobierno de España – Oficina Nacional de Prospectiva y Estrategia. (2021). Spain 2050: Address the shortcomings of our labour market. https://futuros.gob.es/sites/default/files/esp2050/pdf/en/Spain_2050_7.pdf
Gobierno de España – Ministerio de Derechos Sociales y Agenda 2030. (2026). Spain’s 2030 sustainable development strategy. https://www.dsca.gob.es/sites/default/files/derechos-sociales/AGENDA_2030_EDSR_RE_WEB_ENG_0.pdf
Instituto Nacional de Estadística. (2025). Harmonised business demography. Year 2023. https://www.ine.es/dyngs/Prensa/en/DAE2023.pdf
Estructura productiva, productividad y dualidad
Bentolila, S., Dolado, J. J., & otros. (2015). Spain’s structural unemployment rate: Estimates and policy options. Spanish Economic and Financial Outlook, 4(6), 27–46. https://www.sefofuncas.com/Spains-structural-unemployment-rate-Estimates-and-policy-options
CaixaBank Research. (2022, November 24). Companies and productivity: A matter of size. CaixaBank Research. https://www.caixabankresearch.com/en/companies-and-productivity-matter-size
CaixaBank Research. (2023, November 27). Structural unemployment in Spain. CaixaBank Research. https://www.caixabankresearch.com/en/economics-markets/labour-market-demographics/structural-unemployment-spain
Banco de España. (2023). Dual labor markets in Spain: A firm-side perspective (Documentos Ocasionales 23/10). https://www.bde.es/f/webbde/SES/Secciones/Publicaciones/PublicacionesSeriadas/DocumentosOcasionales/23/Files/do2310e.pdf
Romero, J., & Fuentes, A. (2016). Labor market duality: The unresolved issue of the 2012 reform. Spanish Economic and Financial Outlook, 5(7), 77–88. https://www.funcas.es/wp-content/uploads/Migracion/Articulos/FUNCAS_SEFO/005art07.pdf
Joint Research Centre. (2020). Productivity factsheet – Spain (ES). Publications Office of the EU. https://publications.jrc.ec.europa.eu/repository/handle/JRC119785
Autoempleo, PYMES, fiscalidad y entorno empresarial
Civismo. (2026). A tax framework for employment. Fundación Civismo. https://civismo.org/publicaciones/a-tax-framework-for-employment
Citizens Advice Bureau Spain. (2026, March 12). Spain faces EU legal action over failure to implement IVA directive for small businesses. https://www.citizensadvice.org.es/spain-faces-eu-legal-action-over-failure-to-implement-iva-directive-for-small-businesses/
OBN. (2023, September 21). VAT exemption for self-employed and SMEs as of 2025. https://obn.es/vat-exemption-for-self-employed-and-smes-as-of-2025/?lang=en
Murciatoday. (2024, December 12). New contribution rates for self-employed workers in Spain in 2025: Who benefits and who loses out? https://murciatoday.com/new-contribution-rates-for-self_employed-workers-in-spain-in-2025-who-benefits-and-who-loses-out_1000172573-a.html
Sur in English. (2024, December 9). New income-related contribution rates for the self-employed in Spain. https://www.surinenglish.com/spain/self-employed-rates-spain-20241210081417-nt.html
Tech Barcelona. (2024, December 15). Social security in Spain: A complete guide for freelancers in 2024. https://www.techbarcelona.com/posting/social-security-in-spain-a-complete-guide-for-freelancers-in-2024/
TheGlobalEconomy.com. (2022). Spain – Self-employment (% of total employment). https://www.theglobaleconomy.com/Spain/self_employed/
World Bank. (2021). Enterprise surveys: Spain country profile 2021. https://www.enterprisesurveys.org/en/data/exploreeconomies/2021/spain
Pobreza laboral, exclusión y desigualdad
Cantó, O., & Ayala, L. (2014). Working but poor: An analysis of in-work poverty transitions in Spain. Revista Española de Investigaciones Sociológicas, 145, 3–26. https://doi.org/10.5477/cis/reis.145.3
Fundación FOESSA. (2026). IX informe FOESSA sobre exclusión y desarrollo social en España. Cáritas Española. https://www.foessa.es/ix-informe/
Cáritas Española. (2026, January 29). IX informe FOESSA – Exclusión y desarrollo social en España (nota de prensa). https://www.pastoralsocialmadrid.com/ix-informe-foessa-exclusion-y-desarrollo-social-en-espana/
Oxfam Intermón. (2023). Unemployment, inequality and poverty in Spain (varios informes). https://www.oxfamintermon.org/es/informes
Desarrollo sostenible y ODS 8
Martínez-Campillo, A., Fernández-Santos, Y., & García-Lázaro, F. J. (2020). Social economy, gender equality at work and the 2030 agenda: Theory and evidence from Spain. Sustainability, 12(12), 5192. https://doi.org/10.3390/su12125192
Trullén, J., Boix, R., & otros. (2021). EU labor market inequalities and sustainable development goals. Sustainability, 13(5), 2675. https://doi.org/10.3390/su13052675
United Nations. (2025). SDG action segment for Goal 8: Decent work and economic growth. https://sdgs.un.org/sites/default/files/2025-01/SDG%20Action%20Segment%20Goal%208%20(1).pdf[55]
Gobierno de España – Ministerio de Derechos Sociales y Agenda 2030. (2026). Spain’s 2030 sustainable development strategy. https://www.dsca.gob.es/sites/default/files/derechos-sociales/AGENDA_2030_EDSR_RE_WEB_ENG_0.pdf