
Authors: Santiago Sainz · Álvaro Rodríguez
DOI: https://doi.org/10.5281/zenodo.21455665
Colophon and Institutional Notice
El Niño 2026: Global Food Security, Economic Disruption, Conflict Risk, and Migration Implications. A Joint Strategic Assessment.
Published by the International Sustainable Development Observatory (ISDO), Zaragoza, Spain. Registered under Spanish law; operating under the domain isdo.ch.
Authors: Santiago Sainz, President and Head of the Economics & Social Affairs Department, ISDO. Álvaro Rodríguez, Security & Intelligence Department Analyst, ISDO.
Released under Creative Commons Attribution-NonCommercial 4.0 International License (CC BY-NC 4.0). Non-commercial reproduction with full attribution is permitted. Commercial use requires prior written consent from ISDO. Full license text: https://creativecommons.org/licenses/by-nc/4.0/
Disclaimer: The findings, projections, and recommendations in this report reflect the analytical judgment of the authors based on publicly available data as of early July 2026 and do not represent the official position of any government, international organization, or funding body.
For permissions, corrections, and institutional inquiries: isdo@isdo.ch
Abstract
A high-intensity El Niño event is confirmed as forming in the tropical Pacific as of June–July 2026. NOAA issued an El Niño Advisory on June 11, 2026; the World Meteorological Organization assigns El Niño probability at or above 90% for the second half of 2026; and the International Research Institute for Climate and Society (IRI) at Columbia University assigns 100% probability of El Niño conditions through at least November 2026, with subsurface ocean heat content at nearly double its equivalent June 2023 level. This joint strategic assessment, produced by the ISDO Economics & Social Affairs Department and Security & Intelligence Department, provides a comprehensive, evidence-based analysis of the cascading risks generated by this event across six interconnected domains: agricultural production and food security, global commodity markets and food prices, forced displacement and migration, conflict and state fragility, macroeconomic performance, and humanitarian response architecture.
The report documents that 52.8 million people in West Africa and the Sahel are already projected to face acute food insecurity (IPC Phase 3+) in the June–August 2026 lean season before El Niño reaches its peak; that Southern Africa, which suffered its worst drought in a century during the 2023–24 event (affecting approximately 68 million people), faces a renewed drier-than-normal 2026/27 rainy season beginning around October 2026; that the climate-conflict nexus in the Sahel is empirically grounded and operationally significant, with jihadist organizations documented to exploit resource scarcity for territorial control and recruitment; and that the global economy faces estimated cumulative losses in the range of $3–7 trillion over the event cycle.
Against the worst humanitarian financing backdrop in a decade — with the 2025 global appeal receiving only $12 billion — the report argues that the $202 million FAO/WFP Joint Anticipatory Action Appeal, which offers documented returns of up to $7 per $1 invested, represents the highest-return risk-reduction opportunity currently available in the global humanitarian system.
Keywords: El Niño; ENSO; food security; IPC; Sahel; Southern Africa; Horn of Africa; commodity markets; migration; conflict; anticipatory action; FAO; WFP; NOAA; WMO.
Acknowledgments
The authors are grateful to the following institutions and individuals whose data, publications, and public analyses form the evidential backbone of this report. All citations are to publicly available sources; ISDO has not received funding from any of the institutions cited, and all analytical judgments are those of the authors.
Meteorological data: NOAA/Climate Prediction Center; WMO/Global Climate Observing System; IRI, Columbia University; ECMWF; Australian Bureau of Meteorology.
Food security and agricultural data: FAO — Agricultural Stress Index, GIEWS, Food Outlook, Food Price Index; WFP; FEWS NET (USAID); Cadre Harmonisé/CILSS; ICPAC/GHACOF; IPC Global Network.
Humanitarian and migration data: IOM Displacement Tracking Matrix; UNHCR; OCHA Financial Tracking Service.
Security and conflict analysis: Institute for Economics and Peace; ACLED; Tony Blair Institute for Global Change; UNODC.
Economic and financial analysis: Callahan and Mankin (2023, Science); Citigroup Global Perspectives & Solutions; World Bank; African Risk Capacity; Swiss Re Institute.
List of Abbreviations
| Abbreviation | Full Term |
| ACLED | Armed Conflict Location and Event Data Project |
| AMIS | Agricultural Market Information System (G20) |
| ARC | African Risk Capacity |
| BOM | Australian Bureau of Meteorology |
| CERF | UN Central Emergency Response Fund |
| CH | Cadre Harmonisé |
| CPC | Climate Prediction Center (NOAA) |
| DTM | Displacement Tracking Matrix (IOM) |
| ECMWF | European Centre for Medium-Range Weather Forecasts |
| ENSO | El Niño-Southern Oscillation |
| FAO | Food and Agriculture Organization of the United Nations |
| FEWS NET | Famine Early Warning Systems Network |
| FPI | Food Price Index (FAO) |
| GHACOF | Greater Horn of Africa Climate Outlook Forum |
| GIEWS | Global Information and Early Warning System (FAO) |
| GTI | Global Terrorism Index (IEP) |
| ICPAC | IGAD Climate Prediction and Applications Centre |
| IEP | Institute for Economics and Peace |
| IMF | International Monetary Fund |
| IOM | International Organization for Migration |
| IPC | Integrated Food Security Phase Classification |
| IRI | International Research Institute for Climate and Society (Columbia) |
| IS-Sahel | Islamic State in the Greater Sahara |
| ISDO | International Sustainable Development Observatory |
| JNIM | Jamaa Nusrat ul-Islam wa al-Muslimin |
| LPA | Long-Period Average |
| NOAA | National Oceanic and Atmospheric Administration |
| OCHA | Office for the Coordination of Humanitarian Affairs |
| ONI | Oceanic Niño Index |
| SAPP | Southern African Power Pool |
| SST | Sea Surface Temperature |
| UNHCR | United Nations High Commissioner for Refugees |
| WFP | World Food Programme |
| WMO | World Meteorological Organization |
EXECUTIVE SUMMARY
Executive Summary
| CRITICAL WINDOWThe policy window for effective anticipatory action in the 2026 El Niño cycle runs from June to September 2026.After September 2026, the meteorological event will have achieved sufficient intensity that the costs of inadequate preparation will begin to materialize as production losses, price spikes, displacement surges, and, in the worst-affected regions, conflict escalation.Every dollar invested in anticipatory action before this window closes returns up to $7 in avoided losses (FAO, 2025; Bailey & Harvey, 2017, World Development). |
The Event
A high-intensity El Niño is confirmed as forming in the tropical Pacific as of June–July 2026, following the decay of the 2025–26 La Niña and a rapid boreal-spring warming of sea surface temperatures (SSTs) in the central and eastern equatorial Pacific. The National Oceanic and Atmospheric Administration (NOAA) issued a formal El Niño Advisory on June 11, 2026. The World Meteorological Organization (WMO) May 2026 Update assigned El Niño probability at approximately 80% for the July–August period, rising to or above 90% thereafter. The International Research Institute for Climate and Society (IRI) at Columbia University assigned 100% probability of El Niño conditions through September–November 2026, with 13 of 24 dynamical models projecting a “very strong” event (Niño 3.4 ≥ +2.0°C) at peak.
The weekly Niño 3.4 SST anomaly reached +1.7°C by mid-June 2026, up from +0.48°C in the March–May three-month mean. Upper-300m ocean heat content in the central and eastern equatorial Pacific was reported by IRI as nearly double its equivalent June 2023 level, a thermal reservoir diagnostic that historically predicts continued surface warming. NOAA’s Climate Prediction Center assigns a 63% probability of a “very strong” event (peak Niño 3.4 ≥ +2.0°C), comparable to the 1997–98 “super El Niño.”
The Stakes: Seven Key Findings
1. 52.8 million people already face acute food insecurity (IPC Phase 3+) in West Africa and the Sahel in the June–August 2026 lean season (the highest figure ever recorded in the region) before El Niño has reached its peak. A below-normal June–August 2026 West African Monsoon would damage the 2026/27 harvest and extend this emergency into a third consecutive year of near-record need.
2. Southern Africa, which suffered its worst drought in a century during the 2023–24 El Niño event (affecting approximately 68 million people and forcing six national disaster declarations), is expected to face a renewed drier-than-normal 2026/27 rainy season beginning around October 2026. The Kariba Dam, which fell to 7.7% of usable storage capacity in September 2024 (forcing daily load-shedding of up to 21 hours in Zambia) has not fully recharged, leaving the hydropower sector vulnerable to a second consecutive drought year.
3. Global food markets are currently well-supplied (FAO Food Price Index: 130.3 in June 2026, 18.4% below its March 2022 peak) but exposed to material tail risks. A realized strong El Niño could cut rice output by 20–50% in exposed regions of South Asia, Southern Africa, and Southeast Asia (World Bank, 2026 Commodity Markets Outlook). The 2023 India rice export ban precedent, which lifted Indica benchmark prices by up to 40%, demonstrates the amplification potential of unilateral trade policy responses.
4. The probability of new civil conflict onset in the tropics approximately doubles in El Niño years, from roughly 3% to 6% (Hsiang, Meng & Cane, 2011, Nature). In the Sahel, this statistical association has an operational correlate: JNIM and IS-Sahel are documented to exploit drought, water infrastructure control, and food provision as mechanisms for territorial influence, financing, and recruitment. The Tony Blair Institute for Global Change documented a 40% increase in the deliberate destruction of water infrastructure by armed groups in the Sahel between 2019 and 2024.
5. Drought-induced displacement is accelerating. IOM’s Displacement Tracking Matrix recorded a 22% year-on-year increase in drought-related displacement in Somalia in early 2026, with drought accounting for three of every four new displacements. The Sahel-to-Mediterranean, Horn-to-Gulf, and Central America-to-US migration corridors are all exposed to compounding climate-conflict-hunger dynamics that will intensify as the El Niño deepens.
6. Economic costs are measured in trillions. Callahan and Mankin (2023, Science) attributed $4.1 trillion and $5.7 trillion in cumulative global income losses to the 1982–83 and 1997–98 events. Citigroup’s 2026 assessment projects a base case of $3–5 trillion in losses over five years, rising to $7 trillion under a super El Niño scenario. At the national level, most-affected economies could see GDP reduced by up to 1.7 percentage points (FAO/Anticipation Hub, 2024).
7. The response architecture exists but is in practice underfunded. The 2025 global humanitarian appeal received only $12 billion, the lowest in ten years. FAO and WFP have launched their first-ever Joint Anticipatory Action Appeal, seeking $202 million to protect 8.8 million people across 22 high-risk countries. This appeal delivers up to $7 in avoided losses per $1 invested. Full funding of this appeal is the single highest-return intervention available in the current policy environment.
Priority Recommendations
| THREE IMMEDIATE PRIORITIES (BEFORE SEPTEMBER 2026)1. FUND: Fully fund the $202M FAO/WFP Joint Anticipatory Action Appeal by end-August 2026. Every week of delay reduces the window for trigger-based agricultural, livestock, and social protection activities.2. INSURE: Pre-position sovereign parametric risk insurance (ARC and equivalents) for all high-risk Southern African states before the October 2026 season. Zimbabwe’s $31.8M ARC payout in 2024 demonstrated week-not-month disbursement speed.3. COORDINATE: Secure G20 standstill commitments against staple food export restrictions before December 2026 to prevent a repeat of the 2023 price contagion episode. |
CHAPTER 1
1. Introduction, Scope, and Methodology
1.1 Background and Rationale
The El Niño-Southern Oscillation (ENSO) is the most consequential source of interannual climate variability on Earth. In its warm phase (El Niño), it shifts global precipitation and temperature patterns in ways that simultaneously affect agricultural production across multiple continents, commodity prices in globally integrated markets, human mobility patterns in fragile regions, and the resource pressures that interact with governance failures and violent conflict. No other single climatic phenomenon generates comparable and simultaneous shocks across food, migration, security, and economic systems.
El Niño events have historically been among the most foreseeable large-scale humanitarian risks. Modern ENSO forecasting systems, anchored by NOAA’s Climate Prediction Center, WMO’s Global Framework for Climate Services, and the IRI at Columbia University, provide probabilistic outlooks at four-to-eight-month lead time with demonstrably useful skill. The fundamental knowledge infrastructure for anticipatory action has existed since the 1990s (Barnston et al., 1999, Weather and Forecasting). Yet the humanitarian system has consistently struggled to translate that knowledge into timely, adequately resourced action before shocks materialize.
This report is produced in the window between the confirmed onset of El Niño (NOAA Advisory, June 11, 2026) and the expected peak of the event (September–December 2026). It is designed to serve three simultaneous purposes:
- To provide the most current, evidence-based assessment of the El Niño 2026 event and its cascading risks, grounded in the primary data and institutional analysis available as of early July 2026;
- To translate that assessment into specific, actionable, and time-bound policy recommendations calibrated to the actors and institutions best positioned to respond; and
- To contribute to the institutional knowledge base on El Niño impact assessment by making the analytical methodology (the sources, assumptions, and uncertainty estimates) explicit and reproducible.
It is produced by ISDO’s Economics & Social Affairs Department and Security & Intelligence Department jointly, reflecting a deliberate analytical decision: the cascading effects of El Niño cannot be adequately analyzed or responded to within a single disciplinary or sectoral framework. Food security without attention to migration produces incomplete analysis of vulnerability. Migration without attention to conflict misses the most important threat multiplier in El Niño’s impact chain. Economic analysis without attention to humanitarian system capacity underestimates the institutional constraints on response. This report attempts a genuinely integrated analysis.
1.2 Research Questions
The analysis in this report is organized around six primary research questions:
1. How intense and how long will the 2026 El Niño be, and how does it compare to prior events? (Chapter 2)
2. In which regions will the 2026 El Niño produce the most severe agricultural and food security consequences, for which populations, and on what timelines? (Chapter 3)
3. What are the expected effects of the 2026 El Niño on global food commodity markets, with what price and supply-chain implications? (Chapter 4)
4. How will the 2026 El Niño affect forced displacement and migration dynamics, with what implications for receiving communities and states? (Chapter 5)
5. What are the El Niño’s implications for armed conflict and state fragility, particularly in the Sahel, the Horn of Africa, and other high-risk convergence zones? (Chapter 6)
6. What are the expected macroeconomic and sectoral consequences of the 2026 event, and what institutional mechanisms exist (and remain underfunded) for anticipatory response? (Chapters 7–8)
1.3 Analytical Framework: The ISDO Multi-Domain Risk Assessment Model
This report applies ISDO’s Multi-Domain Risk Assessment (MDRA) model, which organizes the analysis of complex climate-humanitarian events around four analytical dimensions:
- Exposure: Which populations, agricultural systems, and economies are directly exposed to El Niño teleconnections, as defined by regional climate science and historical event analysis?
- Vulnerability: Among those exposed, which are most vulnerable based on pre-existing food security status, conflict exposure, institutional capacity, and economic fragility?
- Cascading effects: How do the direct impacts in the first domain (agricultural and climate) cascade into secondary (economic, humanitarian) and tertiary (migration, conflict) effects, and through what mechanisms?
- Response adequacy: What response mechanisms exist, what is their proven effectiveness, what is their current funding status, and what is the gap between funded and required response capacity?
The MDRA framework explicitly rejects a single-domain analytical approach in which food security, migration, conflict, and economics are treated as separate categories. It treats them as nodes in an interconnected system, where interventions in one domain (for example, anticipatory food security assistance) have measurable effects in other domains (for example, conflict prevention through reduced resource competition and jihadist recruitment opportunity). This systems perspective is the primary analytical contribution of the integrated multi-departmental approach.
1.4 Data Sources, Quality, and Limitations
This assessment draws on primary data and institutional analysis from five categories of sources. Each category is accompanied by a quality assessment and a statement of the limitations relevant to the claims built on that source:
1.4.1 Meteorological and Climate Forecasting Sources
Primary sources: WMO El Niño/La Niña Updates (monthly; May 2026 used as most current at time of writing); NOAA/CPC Monthly ENSO Diagnostic Discussion and El Niño Advisories; IRI ENSO Forecast probability tables (June 2026); ECMWF extended-range ensemble output; Australian Bureau of Meteorology ENSO Outlook and weekly SST data; ICPAC/GHACOF seasonal climate outlooks for the Greater Horn of Africa.
Quality assessment: High. These are the authoritative operational centers whose forecasts carry formal policy implications and whose methodologies are transparent, peer-reviewed, and subject to ongoing verification. IRI’s probability tables are updated monthly based on multi-model ensemble consensus and represent the global scientific consensus.
Limitations: The “spring predictability barrier” (boreal March–May) limits forecast accuracy during the critical onset period; forecasts made after June carry higher confidence than those from earlier in the year. The warming background climate complicates the use of historical ENSO analogues (ECMWF introduced its “Relative Niño” index specifically to address this issue in June 2026). Peak intensity estimates carry wider uncertainty ranges than onset timing.
1.4.2 Food Security and Agricultural Data
Primary sources: FAO Agricultural Stress Index (ASI); FAO Food Outlook (biannual, June 2026); FAO Food Price Index (monthly, June 2026); FEWS NET country-specific reports (monthly or bimonthly, June 2026); Cadre Harmonisé analysis (late 2025, early 2026); ICPAC/GHACOF Greater Horn of Africa Climate Outlook Forum (May 2026); IPC Global Network country analyses; USDA World Agricultural Supply and Demand Estimates; South African Weather Service (SAWS) seasonal outlook.
Quality assessment: High for the IPC/Cadre Harmonisé analyses in the Sahel and Horn, which are the result of coordinated multi-agency field assessment processes with standardized methodology. More variable for the FEWS NET projections, which are explicitly forward-looking (8–12 months) and therefore subject to greater uncertainty.
Limitations: IPC Phase classifications are produced at sub-national scale but averaged to national figures in this report; this may mask acute sub-national pockets of more severe conditions. Cadre Harmonisé data is produced for West African states only; the Horn and Southern Africa use different assessment frameworks (IPC, VAC/MUFAN) that are broadly comparable but not identical. IPC projection periods extend 6–8 months ahead; El Niño impacts on the 2026/27 season will not be captured in IPC projections published before October 2026.
1.4.3 Humanitarian, Displacement, and Migration Data
Primary sources: IOM Displacement Tracking Matrix (DTM), Somalia quarterly displacement reports, regional displacement tracking; UNHCR Global Trends in Forced Displacement; OCHA Financial Tracking Service (FTS) for humanitarian funding data; Mixed Migration Centre (4Mi) surveys for migration route data; WFP research on the migration-food insecurity nexus in the Central American Dry Corridor.
Quality assessment: Moderate to high. IOM DTM displacement data is based on primary field enumeration and is methodologically sound, but coverage is uneven across countries and often lags events by 1–3 months. OCHA FTS is wide-ranging for formal humanitarian funding flows but does not capture bilateral government-to-government assistance or informal diaspora remittances.
Limitations: The relationship between climate shocks and cross-border migration is one of the most methodologically contested areas of social science, and the data available to establish causal relationships is consistently weaker than data for food security or meteorological outcomes. This report presents the available evidence while explicitly acknowledging the causal uncertainty.
1.4.4 Security and Conflict Data
Primary sources: Armed Conflict Location and Event Data Project (ACLED), event-level conflict data; Institute for Economics and Peace (IEP) Global Terrorism Index 2024; Tony Blair Institute for Global Change Sahel security analysis; UN Panel of Experts reports on Mali, Burkina Faso, Niger; Europol and national law-enforcement reporting on trafficking networks.
Quality assessment: ACLED is the most wide-ranging event-level conflict dataset available and is widely used in academic research; it has documented coverage limitations in areas with restricted media access. The GTI relies on multiple data sources and is methodologically transparent. Tony Blair Institute analysis is of high quality but should be read as policy-oriented analysis rather than primary data.
Limitations: The empirical relationship between El Niño and civil conflict (grounded in Hsiang, Meng & Cane (2011)) is a statistical association whose precise causal mechanisms are debated. This report consistently presents El Niño as a “threat multiplier” rather than a deterministic cause of violence, consistent with the preponderance of peer-reviewed evidence.
1.4.5 Economic and Financial Data
Primary sources: Callahan and Mankin (2023, Science); Nature Communications (2023); Citigroup Global Perspectives & Solutions (2026 El Niño scenario analysis); World Bank Commodity Markets Outlook (June 2026); IMF World Economic Outlook Update (July 2026); African Risk Capacity annual reports and payout documentation; Swiss Re Institute Natural Catastrophe Data.
Quality assessment: High for the peer-reviewed macroeconomic analysis (Callahan & Mankin; Nature Communications). Moderate for the Citigroup scenarios, which are proprietary modeling exercises presented for directional guidance rather than precise point estimates.
1.5 El Niño Primer: Mechanism, History, and Measurement
El Niño is the warm phase of the El Niño-Southern Oscillation (ENSO), a natural coupled ocean-atmosphere climate variability system centered on the tropical Pacific. During El Niño events, the normally cold sea surface temperatures (SSTs) of the central and eastern equatorial Pacific warm abnormally, typically by more than 0.5°C above the 1991–2020 baseline averaged over the Niño 3.4 monitoring region (5°N–5°S, 170°W–120°W) on a three-month running mean. This warming is not merely a local phenomenon. It drives large-scale changes in the atmospheric circulation, particularly in the Walker Circulation, the overturning east-west flow that normally carries moisture westward across the Pacific, that propagate globally through what meteorologists call “teleconnections,” affecting precipitation, temperature, and drought patterns on every inhabited continent.
The physical mechanism proceeds in three stages. During the buildup phase, equatorial trade winds weaken or reverse, allowing the warm water pooled in the western Pacific “warm pool” to spread eastward. As this warm water reaches the central and eastern Pacific, it heats the overlying atmosphere, releasing additional convective energy that further disturbs the atmospheric circulation. In the response phase, the altered atmospheric circulation shifts rainfall patterns: regions that normally receive moisture from the Walker Circulation (the western Pacific, parts of Africa, the Americas) receive less; regions that receive cold upwelling (the South American coast, parts of the Horn of Africa) receive anomalously warm conditions that alter local weather. The decay phase occurs when the westerly wind anomalies weaken, allowing the thermocline to shoal and SSTs to return toward normal, sometimes transitioning to La Niña conditions.
ENSO events are classified by intensity using the magnitude of the Niño 3.4 SST anomaly on a three-month running mean: Weak (0.5–0.9°C), Moderate (1.0–1.4°C), Strong (1.5–1.9°C), and Very Strong (≥2.0°C). The Oceanic Niño Index (ONI), calculated by NOAA as the three-month running average of Niño 3.4 anomalies, is the standard operational measure.
The modern satellite-era record of El Niño monitoring began with the 1982–83 event, which was not detected in its early stages by the then-existing observation network, a failure that catalyzed the development of the TAO/TRITON mooring array in the equatorial Pacific and ultimately the Global Climate Observing System (GCOS). The 1982–83 event caused widespread drought across Southern Africa, the Horn, Australia, and parts of South Asia, and flooding along the Pacific coasts of South America. The 1997–98 event, the strongest in the modern record at +2.4°C peak Niño 3.4, was forecast up to 18 months in advance, demonstrating the potential of modern ENSO prediction systems. The 2015–16 event matched or exceeded 1997–98 in some metrics and produced the worst Southern African drought in 35 years.
| Key Measurement Concepts Used in This Report Niño 3.4 region: The primary monitoring zone for El Niño, covering the tropical Pacific from 5°N to 5°S, 170°W to 120°W.Oceanic Niño Index (ONI): NOAA’s standard measure, calculated as the three-month running mean of Niño 3.4 SST anomalies. El Niño is declared when ONI ≥ +0.5°C for five consecutive overlapping three-month seasons.Relative Niño index (ECMWF, 2026): A new index that adjusts the ONI for the warming background climate, enabling more accurate comparisons with historical events measured against a cooler baseline.Teleconnection: A statistically significant correlation between climate variables at widely separated geographic locations, mediated by large-scale atmospheric circulation patterns. El Niño teleconnections produce predictable regional signals with known seasonal timing.Spring Predictability Barrier: The reduction in ENSO forecast skill that occurs when forecasts are made during the boreal spring (March–May), when the coupled ocean-atmosphere system is least constrained. Forecasts made after June carry substantially higher confidence. |
1.6 Climate Change Interaction: Beyond Historical Analogues
Climate change modifies the impacts of El Niño events in ways that make simple historical analogues, “this event resembles 1997–98, therefore the impacts will be similar”, systematically misleading. Several modification pathways are relevant to the 2026 assessment:
First, background warming amplifies temperature extremes. Any given El Niño SST anomaly is superimposed on a background sea surface temperature that has been rising at approximately 0.1–0.2°C per decade. Global mean surface temperature in 2024 exceeded 1.5°C above pre-industrial levels for the first time on an annual basis (WMO State of the Global Climate, 2025). Agricultural systems and pastoralists operating in hot, dry regions are therefore experiencing El Niño-induced heat stress on a warmer baseline, with narrower buffers before critical thresholds are crossed.
Second, precipitation extremes are intensifying. A warming atmosphere holds approximately 7% more water vapor per degree Celsius of warming (the Clausius-Clapeyron relationship), intensifying both drought conditions (when rainfall is suppressed, evapotranspiration is higher) and flooding (when El Niño triggers heavy rainfall, the events are more intense). The 2023–24 event produced both record droughts in Southern Africa and catastrophic flooding in the Horn of Africa, reflecting this “wetter wet/drier dry” amplification.
Third, the “Relative Niño” measurement challenge. ECMWF introduced its “Relative Niño” indices in June 2026 specifically to address the fact that standard ONI measurements against the 1991–2020 baseline may produce paradoxical results: as the ocean warms globally, El Niño anomalies measured against the current warmer baseline appear smaller than anomalies measured against a baseline from three decades ago, even when the absolute SST and associated atmospheric impacts are as large or larger. The Relative Niño framework attempts to separate the ENSO signal from the background warming trend. Readers comparing 2026 to 1997–98 should be aware that the comparison depends in practice on which baseline is used.
Fourth, attribution of impacts to El Niño versus climate change is increasingly difficult. The 2023–24 El Niño produced food security and drought outcomes in Southern Africa that many analysts described as “the worst in a century” despite the event being classified as merely “Strong” rather than “Very Strong.” Research by Verschuur et al. (2023, Nature Climate Change) found that climate change substantially amplified the impacts of the 2015–16 El Niño on East African food security, contributing approximately 40% of the drought impact attributable to the event. This interaction effect is likely to be at least as large (and probably larger) in 2026.
1.7 Forecast Uncertainty and Scenario Design
This report presents three scenarios for the 2026 El Niño’s peak intensity, based on the June 2026 operational forecast consensus. These scenarios are used throughout Chapters 3–8 to bound the quantitative projections offered:
Scenario A: Moderate El Niño (Niño 3.4 peak +1.0°C to +1.4°C)
Probability: approximately 15–20% based on June 2026 model ensemble. In this scenario, the event is real and consequential but substantially weaker than the 2023–24 and 2015–16 events. Regional food security impacts are serious but contained within the range that current humanitarian systems, if adequately funded, could address without catastrophic breakdown. Global food commodity market impacts are limited.
Scenario B: Strong El Niño (Niño 3.4 peak +1.5°C to +1.9°C)
Probability: approximately 25–30%. Comparable to the 2023–24 event. This is the conservative central case for this report’s quantitative estimates. Southern African drought impacts are severe; Sahel monsoon suppression is real; Indian monsoon deficit is serious; global rice markets are under pressure. This scenario is consistent with the conservative end of the WMO and NOAA characterizations (“strong” event).
Scenario C: Very Strong El Niño (Niño 3.4 peak ≥ +2.0°C)
Probability: approximately 55–63% (NOAA: 63%; IRI: 13/24 models). This is the modal forecast as of June 2026. Comparable to the 2015–16 and 1997–98 events. Southern African agricultural collapse is severe; Sahel impacts are compounded with a third consecutive difficult year; India monsoon deficits sharply stress staple production; global food prices spike; economic losses are in the $5–7 trillion range. This scenario drives the “worst-case” humanitarian and security implications discussed throughout this report.
This report’s central analysis and policy recommendations are calibrated to Scenario C as the modal forecast, with Scenario B as a conservative baseline. Readers should assume that the humanitarian response architecture is already underdimensioned for Scenario B; the gap widens sharply under Scenario C.
1.8 Ethical Framework and Analytical Standards
ISDO adheres to the following analytical standards in this report:
- All quantitative figures derived from third-party sources are explicitly cited. Where figures are ISDO’s own calculations from third-party data, this is stated.
- Projections are clearly distinguished from documented facts. The language “projected,” “estimated,” and “forecast” is used consistently for forward-looking statements; “documented,” “recorded,” and “observed” for historical facts.
- Causal claims are explicitly distinguished from correlational claims. The El Niño-conflict nexus is presented as an empirically grounded correlation with contested causal mechanisms, not as a deterministic causal relationship.
- El Niño is presented as a threat multiplier in conflict-prone regions, not as a justification for securitizing humanitarian response or reducing the obligation of states and the international community toward displaced populations.
- The analytical distinction between climate refugees and economic migrants is explicitly preserved where relevant, consistent with the UNHCR Climate and Disaster Displacement guidance (2023).
CHAPTER 2
2. Meteorological Framework: The 2026 El Niño in Context
2.1 ENSO Monitoring Infrastructure and the 2026 Data Record
The detection and characterization of El Niño events depends on a globally distributed observation network whose current architecture was largely shaped by the surprise of the 1982–83 event. The failure of monitoring systems to detect that event until it was already well-developed prompted the development of the Tropical Atmosphere Ocean (TAO) mooring array, 70 moored buoys spaced across the equatorial Pacific between 8°N and 8°S, and ultimately the wide-ranging multivariate monitoring framework in use today. The current system integrates: the TAO/TRITON mooring array; Argo profiling floats providing three-dimensional ocean temperature data to 2,000m depth; NOAA and EUMETSAT geostationary satellite SST retrievals; GOES and Meteosat atmospheric wind-vector data; and the NCEP/NCAR climate reanalysis products that provide historical context.
The Niño 3.4 SST anomaly: the primary operational diagnostic for El Niño detection and classification, is calculated as the deviation from the 1991–2020 climatological baseline on a three-month running mean. As of the July 2026 assessment period, the following readings are on record:
- March–May 2026 (DJF-MAM average): +0.48°C, ENSO-neutral to weak El Niño threshold
- May 2026 (single month): +0.94°C, above Weak threshold; El Niño onset signal
- Mid-June 2026 (weekly): +1.7°C, Moderate-to-Strong threshold; El Niño Advisory conditions
- Week ending June 28, 2026 (BOM Relative Niño 3.4): +1.24°C, warming ~0.3°C per fortnight
The rate of warming, approximately 0.3°C per fortnight in late June 2026, is diagnostically important. Historical analogue studies by IRI researchers (Barnston et al., 2012, Climate Dynamics) found that rapid late-spring/early-summer warming of Niño 3.4 SSTs was one of the most reliable indicators of strong peak events. The June 2026 warming rate is consistent with the development trajectories of the 1997–98 and 2015–16 events during their onset phases.
Subsurface ocean heat content provides the most forward-looking diagnostic available to operational forecasters. The upper-300m ocean heat content in the central and eastern equatorial Pacific acts as a “thermal reservoir” that determines the potential for continued surface SST warming. IRI reported in June 2026 that this heat content was at nearly double its equivalent June 2023 level, a reading that, in the context of the 2023–24 event’s rapid intensification in mid-2023, suggests the 2026 event has a substantially larger energy reservoir to draw on than its predecessor did at the same stage.
Sub-surface temperature anomalies reached up to +6°C between 50 and 150 meters depth across the region from 150°W to 80°W. This deep-ocean thermal structure reflects the accumulation of equatorial Pacific heat content that began with the weakening of trade winds in early 2026, consistent with a “precursor” pattern that historically precedes strong El Niño events by three to six months.
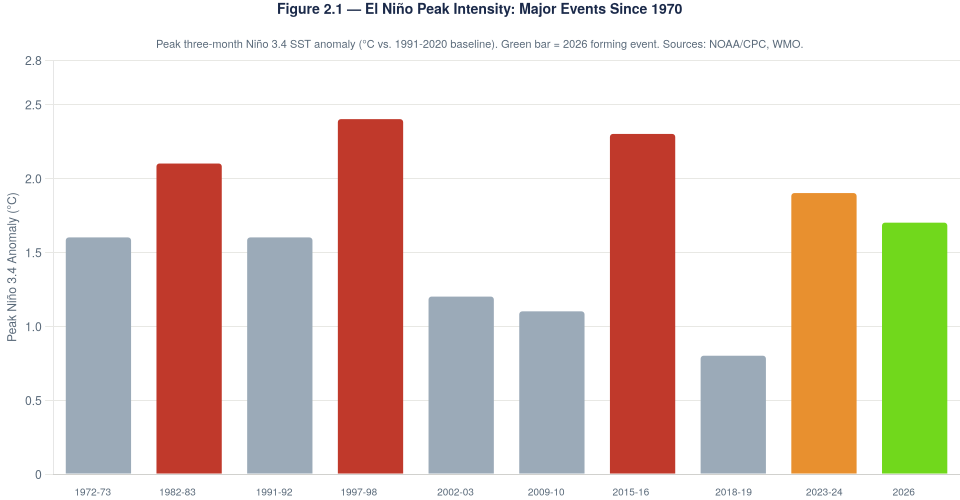
Figure 2.1: El Niño Peak Intensity, Major Events Since 1970. Peak three-month Niño 3.4 SST anomaly (°C vs. 1991–2020 baseline). Green bar = 2026 forming event; red bars = Very Strong classification (≥2.0°C); orange bar = Strong (2023–24). Sources: NOAA/CPC Historical El Niño Events Database; WMO Climate Bulletin.
2.2 Forecast Consensus: WMO, NOAA, IRI, ECMWF, and BOM
The June 2026 forecast consensus from the five leading operational centers provides an unusually convergent picture of El Niño development, reflecting both the advanced stage of the event and the high signal-to-noise ratio in subsurface ocean heat content at this point in the event cycle. The following subsections summarize each agency’s primary findings:
2.2.1 World Meteorological Organization (WMO)
The WMO El Niño/La Niña Update published in May 2026: the most recent at time of writing, assigned El Niño probability at approximately 80% for July–August 2026, rising to at or above 90% for the September–November 2026 period and remaining above 90% through at least January–February 2027. The WMO update explicitly stated that re-development of La Niña is considered unlikely within the forecast horizon.
“The latest forecasts from global climate models and expert assessment indicate a high likelihood of El Niño conditions persisting and strengthening through the rest of 2026. The combination of above-normal sea surface temperatures, weakened trade winds, and anomalous westerly wind bursts in the western Pacific all point to continued El Niño intensification.”
— WMO El Niño/La Niña Update, May 2026
WMO Chief of Climate Prediction at the Climate Services Branch, Wilfran Moufouma Okia, elaborated in a June 2026 press briefing: “We have high confidence in the onset of El Niño, followed by further intensification toward the peak period in the boreal winter. The question is no longer whether El Niño is occurring, but how strong it will become, and on that question, the honest answer is that we expect at least strong, with very strong possible and even plausible.” This framing, confirming the event while expressing calibrated uncertainty about peak intensity, is the appropriate scientific communication standard and is adopted throughout this report.
2.2.2 NOAA Climate Prediction Center (CPC)
NOAA issued an El Niño Advisory on June 11, 2026, the formal declaration that El Niño conditions exist in the tropical Pacific and are expected to continue. The June 2026 Monthly ENSO Diagnostic Discussion assigned a 97% probability of El Niño conditions persisting through the July–September 2026 period, and a 63% probability of the event reaching the “very strong” threshold (ONI ≥ +2.0°C) at peak. The event was expected to strengthen into the Northern Hemisphere winter 2026–27, with a 97% probability of persisting through early spring 2027.
NOAA’s quantification of the 63% probability for “very strong” is particularly important for risk assessment purposes. In a probabilistic framework, 63% for “very strong” means that the modal (most likely single) outcome is a very strong event, but that approximately 37% of the plausible distribution of outcomes involves a merely strong or moderate peak. Risk managers should not plan only for the central-case very strong scenario; they should weight responses toward scenarios consistent with the most severe outcomes in the plausible range, particularly given the asymmetric consequences of underpreparation versus overpreparation.
2.2.3 International Research Institute for Climate and Society (IRI)
The IRI June 2026 ENSO forecast probability table is the most wide-ranging multi-model ensemble assessment available. Key findings: 100% probability of El Niño conditions for the July–September, August–October, and September–November 2026 periods; 99% for October–December and November–January; 13 of 24 dynamical models project a peak in the “Very Strong” category (Niño 3.4 ≥ +2.0°C) during September–November 2026.
IRI researchers also noted, in the June 2026 ENSO Blog published by Columbia University’s Earth Institute, that the subsurface heat content reading, at nearly double the June 2023 level, was “exceptional for this time of year and consistent with the most rapidly intensifying El Niño events in the observational record.” The comparison with June 2023 is instructive: the 2023–24 event had a Niño 3.4 peak of approximately +1.9°C (Strong) despite its June 2023 subsurface conditions being substantially less energetic than those observed in June 2026.
2.2.4 ECMWF
ECMWF’s primary contribution to the June 2026 El Niño assessment is methodological rather than substantive: the introduction of “Relative Niño” indices on June 1, 2026, designed to account for the warming background climate. The conventional Niño 3.4 index measures SST anomalies against the 1991–2020 climatological mean. As global average SSTs warm, the baseline rises, which means that future El Niño events will appear weaker in terms of anomaly, even if the absolute SSTs and associated atmospheric impacts are as large or larger.
ECMWF’s Relative Niño 3.4 adjusts for this trend by removing the global-warming-driven background SST increase before calculating the ENSO anomaly. In practice, for the June 2026 event, the Relative Niño 3.4 index of +1.24°C (week ending June 28) is somewhat lower than the conventional +1.7°C reading, reflecting the fact that the absolute SSTs in the Niño 3.4 region are partially elevated by background warming that has nothing to do with ENSO dynamics. ECMWF noted that the March 2026 ENSO signal was “stronger and more consistent than the 2023 analogue at equivalent lead time” in the Relative Niño framework, a particularly important observation given that the 2023–24 event was classified only as Strong despite producing catastrophic regional impacts.
2.2.5 Australian Bureau of Meteorology (BOM)
The Australian Bureau of Meteorology declared El Niño status on its ENSO Outlook page, with the Relative Niño 3.4 index reaching +1.24°C for the week ending June 28, 2026, and warming approximately 0.3°C per fortnight. BOM’s assessment, reflecting Australia’s particularly strong institutional interest in ENSO forecasting given El Niño’s documented impacts on Australian rainfall, bushfire risk, and agricultural production, noted that “about half of the international climate model suite” indicates a peak among the highest observed since 1950.
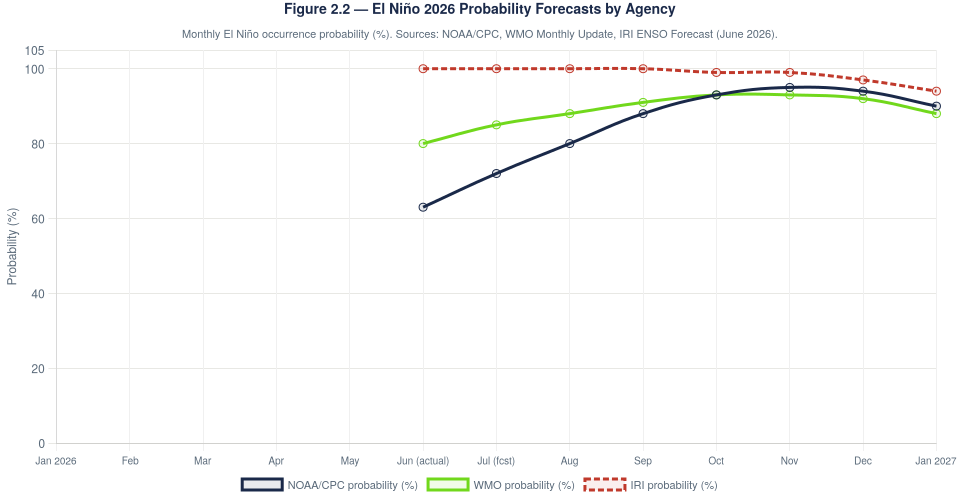
Figure 2.2: El Niño 2026 Probability Forecasts by Agency. Monthly El Niño occurrence probability (%) from NOAA/CPC (June 2026 ENSO Diagnostic Discussion), WMO (May 2026 Update), and IRI (June 2026 multi-model ensemble). IRI probability is at 100% from June through at least November 2026. Note: IRI shows 100% through the period, displayed as a ceiling of 100 on the y-axis.
2.3 Regional Teleconnection Patterns for 2026–2027
ENSO teleconnections, the statistically grounded links between tropical Pacific SST anomalies and regional climate responses, are the mechanism by which El Niño translates into the food security, migration, and security consequences analyzed in subsequent chapters. The following subsections describe the primary teleconnection patterns for the regions analyzed in this report, based on the combination of historical pattern analysis and the specific characteristics of the 2026 event forecast.
It is important to state explicitly what teleconnection analysis can and cannot establish. Historical composites of El Niño event impacts provide the best available probabilistic guidance for regional outcomes. However, no two El Niño events are identical; the precise manifestation of teleconnections in any given season depends on the event’s timing, intensity, and interaction with other modes of variability including the Indian Ocean Dipole (IOD) and the Atlantic Meridional Mode. The probabilities and directions stated below are grounded in the historical record and June 2026 model consensus; they are not deterministic predictions.
2.3.1 West Africa and the Sahel: Monsoon Suppression
The primary El Niño teleconnection for West Africa is suppression of the West African Monsoon (WAM), the seasonal rainfall system that provides the majority of annual precipitation to the Sahel between June and September. The mechanism operates through El Niño’s warming of the equatorial Pacific, which shifts the ascending branch of the Inter-Tropical Convergence Zone (ITCZ) eastward and southward, reducing the meridional temperature gradient that drives moisture northward into the Sahel (Janicot et al., 2001, Journal of Climate). The statistical relationship between El Niño and Sahel rainfall is well established but not uniform across the region: western Sahel (Mauritania, Senegal, western Mali) shows stronger suppression signals than eastern Sahel (Niger, Chad), and the relationship is modulated by Indian Ocean SST anomalies.
For 2026, ICPAC/GHACOF forecasts a high likelihood of below-normal June–September rainfall across the West African Sahel, consistent with the historical El Niño composite and the June 2026 model ensemble. The probability of below-normal rainfall exceeds 50% across most of the region and reaches 60–70% in the western Sahel belt. This signal, if realized, would threaten the planting window for millet, sorghum, and groundnut (the three primary staple crops of the Sahel) compressing the effective growing season and increasing the probability of partial to complete harvest failure in the most marginal zones.
2.3.2 Southern Africa: Austral Summer Drought
Southern Africa is one of the most El Niño-sensitive regions on Earth. The teleconnection mechanism involves El Niño warming of the central-eastern Pacific, which drives anomalous subsidence over Southern Africa during the austral summer (October–March), suppressing convection and reducing rainfall across Zambia, Zimbabwe, Malawi, Mozambique, Namibia, Botswana, and the northern and eastern provinces of South Africa. The probability of below-normal October–March rainfall in Southern Africa during strong El Niño events exceeds 70% in most of the region, based on the historical composite (Lindesay, 1988; Reason et al., 2000).
The South African Weather Service (SAWS) expects the 2026 El Niño to begin influencing Southern African climate from approximately October 2026, with impacts strengthening through the austral spring (September–November) and summer (December–February). FEWS NET’s June 2026 projections explicitly anticipate below-average 2026/27 rainfall in southern Malawi and adjacent regions, and Crisis (IPC Phase 3) outcomes in multiple Malawian districts from October 2026 through January 2027.
2.3.3 Horn of Africa: Bifurcated Seasonal Response
The Horn of Africa experiences a bifurcated El Niño response across its two rainy seasons that creates both acute short-term risk and cautious medium-term recovery potential. The long rains (March–May, known as Gu in Somalia) tend to be suppressed during El Niño events, increasing drought risk in Ethiopia’s Somali region, parts of northern Kenya, and Djibouti. The short rains (October–December, known as Deyr in Somalia) are typically enhanced during El Niño events, an interaction mediated by the positive Indian Ocean Dipole (IOD) that frequently co-occurs with El Niño, potentially producing floods and recovery rainfall that partly offset long-rain deficits.
For 2026, ICPAC/GHACOF’s May 2026 GHACOF seasonal outlook forecasts a high likelihood of below-normal June–September 2026 long rains across South Sudan, Uganda, Ethiopia’s eastern and northeastern regions, Djibouti, and Eritrea, with probability of below-normal rainfall exceeding 60–80% in parts of northeastern Ethiopia. ICPAC noted that the 2026 pattern closely resembles the strong El Niño years of 1997 and 2023, both of which produced severe long-rain deficits in the region.
2.3.4 South Asia: Monsoon Disruption
El Niño’s relationship with the Indian summer monsoon (June–September) is one of the longest-studied El Niño teleconnections, with the inverse correlation between ENSO and Indian rainfall documented by Sir Gilbert Walker in the 1920s (Walker, 1924, Memoirs of the India Meteorological Department). El Niño events suppress Indian summer monsoon rainfall through the suppression of ascending motion over the Bay of Bengal and the enhancement of subsidence over the Indian subcontinent.
However, the statistical relationship has weakened somewhat since the 1980s, likely due to the mediating role of Indian Ocean SSTs (Krishnamurthy & Goswami, 2000, Journal of Climate; Kumar et al., 1999, Science). El Niño events no longer reliably produce severe Indian monsoon droughts; strong events reduce the probability of normal or above-normal rainfall but do not guarantee deficit conditions. The India Meteorological Department (IMD) forecasts the 2026 southwest monsoon at 90% of the long-period average (LPA), with an 84% probability of below-normal or deficient seasonal rainfall.
2.3.5 Southeast Asia: Dry-Season Extension
El Niño’s teleconnection to Southeast Asia operates primarily through reduced convection and precipitation across the Maritime Continent (Indonesia, Philippines, Papua New Guinea) and parts of mainland Southeast Asia (Thailand, Vietnam, Cambodia, Laos). The mechanism involves the eastward displacement of convective activity in El Niño years, which reduces the moisture flux that normally drives wet-season rainfall in these regions. The onset of impact is typically in the late dry season / early wet season (September–October onward), meaning the strongest 2026 Southeast Asian impacts will materialize in late 2026 and early 2027.
2.3.6 Central America: Canícula Intensification
El Niño’s relationship with Central American rainfall is complex, involving a mix of Pacific and Caribbean influence. The primary signal for the Central American Dry Corridor is an intensification and extension of the canícula (mid-summer dry spell, normally July–August), suppression of first-season May–July rainfall, and a potentially shorter or more erratic rainy season overall. The mechanism involves El Niño’s warming of the Pacific off the Central American coast, which disrupts the moisture flux from the Pacific into the Guatemala Highlands and Honduras mountain ranges that drives rainfall in the Dry Corridor. FAO climate forecasts indicate below-average May–July 2026 rainfall for the Corridor, and a likelihood of continued El Niño signal through the second season (September–November 2026).
2.4 Comparative Event Analysis: Lessons from Prior Very Strong Events
Three prior very strong El Niño events (1982–83, 1997–98, and 2015–16) provide the primary analogues for understanding the potential magnitude of 2026 impacts. The 2023–24 event, despite being classified as Strong rather than Very Strong, is the most methodologically relevant analogue given its proximity in time and its occurrence under a more similar background climate state. This section synthesizes the key lessons from each.
2.4.1 The 1982–83 Event: The Benchmark
The 1982–83 El Niño, which peaked at approximately +2.1°C Niño 3.4, was the first event to catalyze systematic global analysis of El Niño impacts. Its consequences included: a 7-year return-period drought across Southern Africa affecting 150 million people (Buckland et al., 2004); the worst Ethiopian famine since 1973, affecting approximately 6 million people; a 14% reduction in Australian wheat production; and the Peru-Ecuador “flood of the century” that destroyed approximately 12% of Peru’s GDP in a single season. Total estimated economic losses in the $4.1 trillion range (cumulative, Callahan & Mankin, 2023) reflect impacts that persisted for three to five years after the event’s meteorological peak.
2.4.2 The 1997–98 Event: The Super El Niño
The 1997–98 event remains the strongest in the modern observational record at +2.4°C peak Niño 3.4. It was forecast up to 18 months in advance: the first demonstration of the potential for long-lead ENSO prediction, but the anticipatory action capacity of the late 1990s humanitarian system was insufficient to translate that knowledge into commensurate pre-positioning. Key impacts: the worst drought in 50 years across Indonesia and Papua New Guinea; catastrophic floods in East Africa (Kenya, Uganda, Ethiopia) due to the positive IOD and enhanced short rains; a 30% reduction in global rice production forecasts driven by drought in Southeast Asia; and the activation of the first El Niño-related humanitarian response system by the UN Department of Humanitarian Affairs.
2.4.3 The 2015–16 Event: The Structural Fragility Amplifier
The 2015–16 event, peaking at +2.3°C, is the most relevant prior Very Strong event for the current 2026 analysis because it occurred against a background of already-elevated food insecurity in key regions, analogous to the 2026 pre-event baseline. Its consequences included: the worst Southern African drought in 35 years, affecting more than 40 million people and generating a $2.5 billion humanitarian appeal; a 7.9 million metric ton regional maize deficit in SADC; the devastation of 643,000 livestock across five Southern African states; and the triggering of mass cattle destocking events that permanently eroded household asset bases in Zambia, Zimbabwe, and Malawi. Research by Verschuur et al. (2021, Environmental Research Letters) found that climate change amplified the food-security impacts of this event by approximately 20%.
2.4.4 The 2023–24 Event: The Climate-Amplified “Moderate Plus”
The 2023–24 event, classified as Strong (peak Niño 3.4 approximately +1.9°C), produced regional impacts comparable in many areas to those of the 1997–98 “super” event, despite being one category lower in intensity. This apparent paradox is explained by three factors. First, the warming background climate elevated the absolute temperatures associated with the El Niño anomaly, intensifying agricultural heat stress beyond what the ONI metric captures. Second, the region entered the event in a severely weakened state after four consecutive poor rainy seasons in the Horn of Africa (2020–24) and below-normal rainfall across Southern Africa in 2022/23. Third, governance and fiscal capacity in key affected states had weakened materially compared to 2015.
The 2023–24 event produced: six national disaster declarations across Southern Africa; approximately 68 million people affected by drought in the SADC region; the Kariba Dam falling to 7.7% of usable storage capacity (September 2024); $62 million in ARC sovereign insurance payouts; SADC regional maize production approximately 9% below the five-year average; and the largest ARC payout in that mechanism’s history (Zimbabwe: $31.8 million). These outcomes from a “merely Strong” event set the baseline vulnerability from which the 2026 event will operate.
2.5 Forecast Uncertainty Quantification and Monitoring Framework
Professional scientific communication requires explicit quantification of forecast uncertainty rather than point predictions. The following table summarizes the key uncertainties relevant to the 2026 El Niño assessment, their magnitude, and the monitoring indicators that would shift the assessment in either direction:
| Uncertainty | Magnitude | Downside Risk | Upside Risk | Key Monitoring Indicator |
| Peak Niño 3.4 intensity | High (±0.4°C) | Moderate event (~1.3°C): reduced regional impacts | Super event (~2.4°C): 1997-scale agricultural collapse | Monthly ONI; subsurface heat content trend (NOAA) |
| Indian Ocean Dipole interaction | Medium | Negative IOD reduces Horn of Africa short-rain recovery | Positive IOD amplifies Ethiopian/Kenyan short rains | ECMWF/BOM IOD index (updated monthly) |
| India monsoon trajectory | Medium | Below-70% LPA: food insecurity escalation; export ban risk | Near-normal monsoon: India markets stabilize globally | IMD cumulative rainfall updates (weekly, Jun–Sep) |
| Southern Africa season onset | High (±2 weeks) | Late or very dry onset: catastrophic planting failure | Near-normal onset: household adaptation possible | SAWS ENSO outlook updates (monthly, Sep–Nov 2026) |
| Kariba Dam refill trajectory | High | <15% storage entering 2026/27: energy crisis repeat | >30% storage entering season: manageable deficit | Zambezi River Authority monthly storage reports |
| West African Monsoon strength | Medium-High | Monsoon deficit >15% region-wide: widespread harvest failure | Near-normal monsoon: food insecurity contained | ICPAC/FEWS NET rainfall monitoring (weekly) |
| Duration of event | Medium | Persist through austral summer 2027: second consecutive drought year | Early La Niña transition: relief for Southern Hemisphere | WMO La Niña probability forecasts (monthly) |
Table 2.1: Forecast uncertainty quantification for the 2026 El Niño event. Monitoring indicators to be tracked monthly through March 2027. Sources: NOAA/CPC, WMO, ECMWF, SAWS, ICPAC, Zambezi River Authority.
2.6 Expert Commentary and Divergent Views
Scientific discourse on the 2026 El Niño has produced several areas of expert disagreement that are worth documenting for analytical transparency. This section notes the primary substantive debates and the ISDO position on each:
The “Super El Niño” framing debate
Several commercial risk consultancies and media outlets have characterized the 2026 event as a “super El Niño” analogous to or exceeding 1997–98. Official WMO and NOAA communications have used more conservative language (“at least moderate to strong; very strong not excluded”). ISDO’s position: the 63% NOAA probability for a very strong event makes the “super El Niño” scenario the modal outcome for planning purposes, but “super” characterizations in public communication (given the uncertainty range) risk producing either complacency if the event is Strong but not Very Strong, or alarm-fatigue if the peak is ultimately lower than the most extreme projections. We recommend “strong-to-very-strong” as the appropriate planning assumption.
The climate change attribution debate
Some researchers have argued that the 2026 El Niño should be characterized primarily as a climate-change-amplified event rather than a ENSO event per se, noting that the background SST warming makes the absolute temperatures in the Niño 3.4 region comparable to historical “super” El Niño anomaly levels even when the ENSO-specific anomaly is smaller. ISDO’s position: the Relative Niño framework (ECMWF) provides a useful correction that should be applied to intensity comparisons with historical events. However, for impact analysis, which depends on absolute SSTs and temperatures, not ENSO anomalies per se, the climate change amplification argument strengthens rather than weakens the case for treating this as a very serious event.
The conflict nexus debate
As noted in Section 1.4.4, the causal relationship between El Niño and civil conflict remains contested in the peer-reviewed literature after the foundational Hsiang, Meng & Cane (2011) study. Subsequent work (Klomp & Bulte, 2013, Journal of Conflict Resolution; Landis, 2014, Journal of Peace Research) found the association to be sensitive to methodological choices. ISDO’s position: the statistical association is genuine and well-established across multiple estimation approaches; the causal mechanism operates through economic stress (food prices, agricultural income) rather than climate directly; and in the Sahel specifically, there is operational evidence (Tony Blair Institute, 2024; ACLED data) that jihadist groups exploit resource scarcity in ways that the aggregate statistical models may undercount. We maintain the “threat multiplier” framing while acknowledging methodological debates.
CHAPTER 3
3. Regional Agricultural and Food Security Impacts
The food security consequences of El Niño events do not follow a uniform global pattern. They concentrate in the regions where the combination of strong teleconnection signals (the meteorological exposure), pre-existing food system fragility (the structural vulnerability), and institutional incapacity (the response deficit) intersect at their most acute. This chapter provides a region-by-region analysis of these converging factors for the seven primary areas of concern identified by the FAO Agricultural Stress Index and the June 2026 operational forecast consensus.
Each subsection follows a common structure: a baseline food security assessment (current IPC or equivalent status before El Niño peak impacts); the specific El Niño teleconnection signals forecast for the region; a crop-by-crop and livelihood system analysis of the expected impacts; quantitative estimates where available from FEWS NET, Cadre Harmonisé, or equivalent systems; and an identification of the most vulnerable sub-regional populations and the specific mechanisms through which El Niño will deepen their precarity.
A note on data vintage: IPC and Cadre Harmonisé classifications are typically produced with a 4–8-month projection horizon. The analyses discussed in this chapter reflect assessments published in April–June 2026, which project to October–December 2026. The El Niño signal for Southern Africa (October 2026 onward) and Southeast Asia (September 2026 onward) will not be fully captured in the available IPC projections; for those regions, this chapter extrapolates from the meteorological forecast and historical analogue analysis.
3.1 West Africa and the Sahel: The Most Acute Current Emergency
3.1.1 Baseline Food Security Status
The Sahel is the region where El Niño’s humanitarian consequences will be most immediate, because it is also the region already facing the worst food security crisis in recorded history. The Cadre Harmonisé (CH), the regional food security assessment system covering 15 West African countries, found in its early 2026 analysis that an estimated 41.8 million people were in IPC Phase 3 (Crisis) or above, with projections for the June–August 2026 lean season indicating 52.8 million people in IPC Phase 3+, including more than 1.4 million in Emergency (IPC Phase 4). No comparable pre-El Niño peak assessment in the history of the Cadre Harmonisé has produced a figure of this magnitude.
The drivers of this baseline are well-documented and multiply compounding: eleven years of jihadist insurgency in the tri-border zone (Mali, Burkina Faso, Niger) that has destroyed agricultural infrastructure, blocked market access, and displaced approximately 2.2 million people since 2012; the structural agricultural vulnerability of a semi-arid system entirely dependent on the seasonal monsoon for crop production; chronic under-investment in soil health, irrigation, and storage infrastructure; the collapse of state service delivery in large areas of the central Sahel following the military takeovers in Mali (2020, 2021), Burkina Faso (2022, twice), and Niger (2023); and the progressive withdrawal of development financing as these states exit the formal international governance framework.
3.1.2 El Niño Agricultural Signal
The primary El Niño threat to the Sahel is suppression of the West African Monsoon during the June–August planting and growing season. The statistical relationship between strong El Niño events and below-normal Sahel rainfall has been documented consistently since Sultan and Janicot (2003, Climate Dynamics) and is well-established across multiple modeling frameworks. For the 2026 event, ICPAC’s June 2026 forecast assigns a 50–65% probability of below-normal June–August rainfall across most of the Sahel belt, with the probability exceeding 70% in the western Sahel (Mauritania, Senegal, western Mali).
The critical period is the monsoon onset date. In a normal year, the Inter-Tropical Convergence Zone (ITCZ) reaches the Sahel by early June, initiating planting across the region. A delayed onset, even by two to three weeks, can compress the growing season from its already-minimal 90–120 days to 60–80 days, which is insufficient for maturation of most millet and sorghum varieties. A late-onset year followed by an early monsoon withdrawal (another common El Niño pattern) compounds the effect: farmers plant late and then lose the terminal moisture that allows grain fill.
3.1.3 Crop and Livelihood System Analysis
Millet (Pennisetum glaucum) is the primary staple crop of the Sahel, occupying approximately 60% of the total cereal area in Burkina Faso, Mali, Niger, and Chad. It is the most drought-tolerant of the major cereals, capable of completing a growing cycle with as little as 200–300mm of rainfall over 75–90 days, but even millet fails when effective rainfall falls below threshold levels during critical development stages (tillering, booting, grain fill). Under a Scenario C (Very Strong) El Niño, FEWS NET projects crop production shortfalls of 25–40% in the most affected Sahel zones, compared to 15–20% under Scenario B.
Sorghum (Sorghum bicolor) (the second most important Sahel cereal) is slightly more water-demanding than millet and occupies most of the southern Sahel where rainfall is more reliable. Under material monsoon deficits, sorghum production shortfalls can exceed those of millet because it is more often planted at the lower end of its moisture-requirement range.
Livestock (cattle, small ruminants, and camels) represent both the primary wealth asset and the major source of income for the pastoralist and agropastoralist populations who account for approximately 40% of the Sahel’s total population. El Niño-driven pasture depletion and water scarcity in 2026 will drive: accelerated and spatially extended transhumance (seasonal livestock movement), crowding traditional corridors and generating inter-communal conflict over access; distress sales of livestock as herd conditions deteriorate, crashing livestock prices and eroding household asset bases precisely when food prices are rising; and mortality events among weaker animals (young, lactating, and old animals die first), permanently reducing herd productivity.
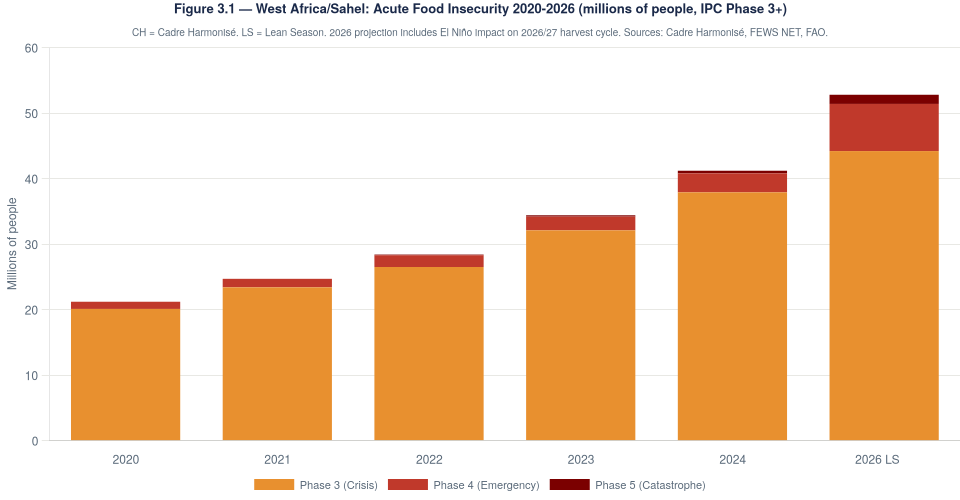
Figure 3.1: West Africa and Sahel: Acute Food Insecurity 2020–2026 (millions of people, IPC Phase 3+). Stacked bars show Phase 3 (Crisis), Phase 4 (Emergency), and Phase 5 (Catastrophe) components. 2026 lean season projection includes El Niño signal on 2026/27 harvest cycle. Source: Cadre Harmonisé (2020–2026 assessments), FEWS NET (2026 projections).
3.1.4 Country-Level Vulnerability Analysis
| Country | IPC Phase 3+ (lean 2026) | El Niño Agricultural Risk | Key Crop at Risk | Critical Vulnerability Factor |
| Burkina Faso | ~6.3M (Phase 3+); 1.4M Phase 4 | CRITICAL, monsoon deficit + conflict = no fallback | Sorghum, cowpea | 72 out of 145 communes with restricted humanitarian access; jihadist control of agricultural zones |
| Mali | ~4.8M Phase 3+; 1.1M Phase 4 | CRITICAL, Liptako-Gourma tri-border: compounded conflict-drought | Millet, rice (Niger River) | JNIM territorial control in Mopti, Ségou; market corridors blocked; Bamako-Gao axis insecure |
| Niger | ~4.3M Phase 3+ | HIGH, Agadez / Tahoua most exposed; pastoral system stressed | Millet, livestock | Post-coup suspension of EU/US development programs; reliance on Russian forces with no development mandate |
| Nigeria (NE/NW) | ~25M Phase 3+ | HIGH, combined Boko Haram / ISWAP conflict + monsoon variability | Maize, sorghum, millet | Largest absolute population at risk; Lake Chad Basin pastoral collapse; ISWAP food-system control |
| Chad | ~4.0M Phase 3+ | MODERATE-HIGH, Lake Chad watershed drying; Sahelian belt exposed | Sorghum, livestock | Lake Chad surface has shrunk 90% since 1960; any additional rainfall deficit is superimposed on structural collapse |
| Mauritania | ~1.2M Phase 3+ | HIGH (western Sahel strong monsoon suppression zone) | Millet, livestock, fisheries | High dependence on fisheries as food security buffer; fisheries also climate-sensitive |
| Senegal | ~1.4M Phase 3+ | MODERATE (stronger institutions; coastal fisheries buffer) | Millet, groundnut | Relatively strong government institutions; coastal fishing sector provides income buffer for non-farming households |
Table 3.1: West Africa and Sahel: Country-level food security status and El Niño exposure assessment. Sources: Cadre Harmonisé (Q1 2026), FEWS NET (June 2026), IPC Global Network.
3.2 Southern Africa: From Crisis to Catastrophe Risk
3.2.1 Baseline: Still Recovering from 2023-24
Southern Africa enters the 2026 El Niño window in a severely weakened state, compounding the structural vulnerability of the upcoming 2026/27 rainy season with the residual impacts of the catastrophic 2023–24 drought. The 2024/25 SADC regional maize harvest of approximately 28.1 million metric tons (9% below the five-year average) reflects a recovery that is partial and uneven. Only South Africa and Tanzania achieved production surpluses; every other SADC state remained in deficit or recovery. The Kariba Dam, which provides hydropower to both Zambia and Zimbabwe, has not returned to its pre-2023–24 storage levels and remains vulnerable to a second consecutive poor rainy season.
Zimbabwe’s situation is emblematic of the regional pattern. The government declared a national disaster on April 3, 2024, appealing for $2 billion in international assistance with approximately 6 million people food insecure. The 2024/25 agricultural season brought partial recovery (above-normal rainfall in some areas) but productivity was constrained by the depletion of household assets (livestock sold under duress in 2024, productive equipment liquidated, seed stocks depleted) and by the fiscal crisis that prevented government investment in agricultural support. The 2025/26 season was near-normal, but the household-level asset base remains far below its pre-2023–24 level.
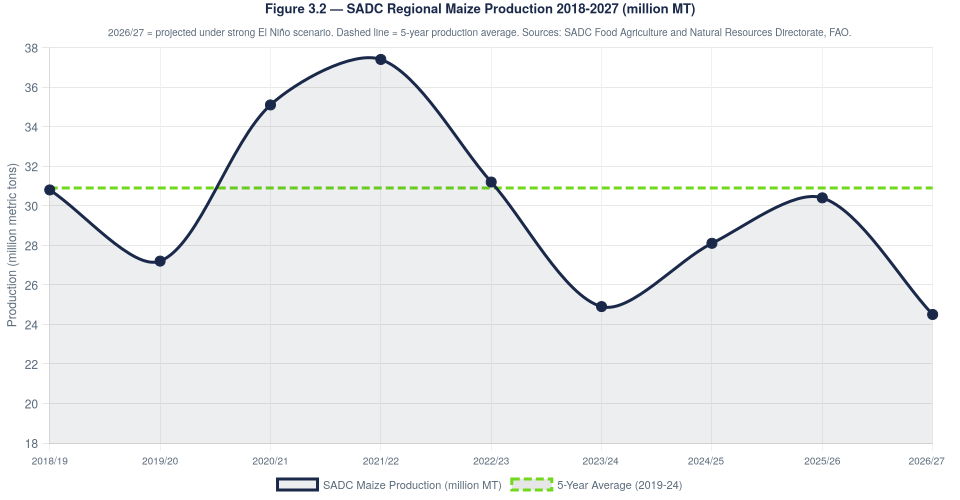
Figure 3.2: SADC Regional Maize Production 2018/19–2026/27 (million metric tons). Dashed green line = 5-year production average (2019–24: 30.9M MT). 2026/27 projection assumes strong El Niño below-normal Southern Africa rainfall season (October 2026–March 2027). Sources: SADC Food Agriculture and Natural Resources Directorate; FAO GIEWS; FEWS NET.
3.2.2 The Hydropower Cascades
The intersection of El Niño, hydropower dependency, and Southern African livelihoods warrants detailed treatment because it is often under-weighted in food security analyses that focus exclusively on crop production. Zambia generates approximately 83% of its electricity from hydropower, the vast majority from the Kafue and Kariba systems. During the 2023–24 El Niño drought, Kariba Lake storage fell to 7.7% of usable capacity by September 2024, the lowest level since the dam’s construction in 1958. The operational consequences were severe and cascading:
- Daily load-shedding of up to 21 hours in Zambia, affecting all economic sectors from copper mining (Zambia’s primary export and foreign-exchange earner) to food processing, refrigeration, and telecommunications;
- Forced shutdown of approximately 800 MW at Zimbabwe’s Kariba North Bank power station, reducing available generation from 1,050 MW installed capacity to approximately 214 MW;
- Hospital operations disrupted; vaccine cold chains at risk; water pumping systems compromised; urban food markets unable to maintain refrigerated storage;
- Copper production losses from extended mine shutdowns, estimated at a reduction of approximately 15–20% of annual output from Zambia’s Copperbelt;
- A multiplier effect on economic output estimated at 2–4% of GDP in direct and indirect losses (Zambia Economic Advisory, 2024).
A repeat of these conditions in 2026/27, which the current Kariba storage trajectory makes plausible if the 2026/27 austral summer is below-normal, would arrive before the reservoir has fully recharged. The Zambezi River Authority’s monthly storage reports are the critical near-term monitoring indicator for this risk. If Kariba storage falls below 20% of usable capacity by November 2026, operators will face the same impossible choices as in 2024: reduce generation and accept economic shutdown, or maintain generation and risk irreversible damage to the turbines.
| Country | El Niño Risk Rating | Projected IPC Phase (Oct 2026 – Jan 2027) | Primary Agricultural Impact | Critical Infrastructure Risk |
| Zimbabwe | CRITICAL | Phase 3 (Crisis) in Matabeleland, Mashonaland | Maize, groundnut: >40% yield reduction (VS scenario) | Kariba North Bank hydro (1,050 MW installed); fuel import dependence; USD cash shortages |
| Zambia | CRITICAL | Phase 3 across southern and eastern provinces | Maize, soybean: 30–50% yield reduction in deficit zones | Kariba South Bank / Kafue Gorge (3,777 MW total; Sept 2024 low: 1,040 MW operational); copper export revenue |
| Malawi | HIGH | FEWS NET: Phase 3 (Crisis) in southern Malawi districts from Oct 2026 | Maize: primary staple; tobacco: primary export | FX parallel premium >100%; food import financing at risk; limited irrigation |
| Mozambique | HIGH | Phase 3 in southern provinces; variable center-north | Maize, cassava; southern cereal deficit | Cahora Bassa hydropower (2,075 MW); agricultural export revenue (sesame, tobacco) |
| Madagascar | HIGH | Phase 3–4 in southern Madagascar (Grand Sud) | Rice, cassava, maize; southern region food crisis deepening | High cyclone exposure; limited state agricultural support capacity |
| South Africa | MODERATE | Phase 2 (domestic); major importer of vulnerable neighbors | Maize (Northern Cape, Limpopo): yield risk in key producing provinces | Lesotho Highlands Water Project: water supply to Gauteng at risk under severe drought; export food surplus at risk |
| Namibia / Botswana | MODERATE | Phase 3 in northern communal areas | Sorghum, millet, livestock; pasture depletion | Cattle export revenue; groundwater depletion in communal areas |
Table 3.2: Southern Africa: El Niño exposure and vulnerability assessment by country. Risk ratings: CRITICAL = Very Strong El Niño would likely trigger IPC Phase 4 (Emergency) conditions; HIGH = Widespread Phase 3 expected; MODERATE = Phase 3 in vulnerable sub-populations. Sources: FEWS NET, SAWS, SADC, ARC (June 2026).
3.3 Horn of Africa and East Africa: The Bifurcated Season
The Horn of Africa’s food security landscape entering 2026 reflects the cumulative weight of four consecutive below-normal rainy seasons between 2020 and 2024, compounded by the residual effects of the 2023–24 El Niño, ongoing conflict in Somalia, Ethiopia, and Sudan, and the structural fragility of East African food systems that depend on subsistence-level rain-fed agriculture for the majority of rural livelihoods. An estimated 20–25 million people in the Horn of Africa require food assistance as of mid-2026, a figure that predates any El Niño impact on the 2026 long rains.
Somalia presents the most acute convergence of El Niño exposure, conflict, and institutional collapse. IOM’s DTM recorded approximately 62,000 new drought-induced displacements in early 2026 across five Somali districts, with drought accounting for three of every four new displacements, a 22% year-on-year increase. Global Acute Malnutrition (GAM) prevalence in crisis-affected zones reached 11–19% nationally and approximately 25% in IDP settlements in Galkacyo and Bossaso, well above the emergency threshold of 15%. Al-Shabaab controls approximately 40% of rural southern Somalia, levying taxes on agricultural produce, controlling market access, and exploiting the population’s food dependence as a tool of territorial governance.
Ethiopia’s situation is characterized by internal heterogeneity. The eastern and northeastern zones (Somali region, eastern Oromia, eastern Amhara, Tigray) face the highest drought exposure and carry the heaviest burden of cumulative multi-season deficit. The southwestern highlands have more reliable rainfall and stronger agricultural systems. The GHACOF May 2026 forecast assigns 60–80% probability of below-normal June–September long rains in the most vulnerable zones of northeastern Ethiopia, consistent with historical strong El Niño composites.
Sudan represents the most extreme case of climate-conflict interaction in the region. With 33.7 million people in need of humanitarian assistance: the largest national figure globally in the 2026 GHO, and a civil conflict that began in April 2023 having decimated agricultural systems in Darfur, Kordofan, and Blue Nile states, any additional El Niño-driven rainfall deficit carries catastrophic implications. Sudan is explicitly included in the FAO/WFP Joint Anticipatory Action Appeal.
The October–December 2026 short rains (Deyr/Hageya) represent the recovery potential. Historical patterns during positive IOD/El Niño co-occurrence suggest enhanced short rains in Somalia, Kenya, and eastern Ethiopia, a scenario that would provide recovery opportunity for bimodal cropping systems and improve pasture conditions for livestock. However, enhanced short rains in a degraded landscape, with soil structure weakened by multi-season drought, vegetation cover reduced, and water catchment infrastructure destroyed, carry serious flash-flood risk. The beneficial/harmful balance of enhanced short rains depends in practice on their intensity, spatial distribution, and timing.
3.4 South Asia: The India Price-Policy Nexus
India’s importance to the 2026 El Niño food security analysis extends beyond its domestic population of 1.4 billion people. India is the world’s largest exporter of rice (supplying approximately 40% of global rice trade in normal years), one of the largest wheat exporters, and a major source of sugar and pulses. Unilateral Indian trade policy responses to domestic supply concerns, as demonstrated by the July 2023 non-basmati white rice export ban, can amplify global food price spikes to degrees that affect the food security of populations in entirely different regions with no direct exposure to the Indian monsoon.
The India Meteorological Department (IMD) forecasts the 2026 southwest monsoon at 90% of the long-period average (LPA), with an 84% probability of below-normal or deficient seasonal rainfall. Cumulative rainfall through mid-June 2026 was 32% below normal nationally, with particularly large deficits in northwest India (-91%) and central India (-49%). However, India’s buffer stock system, with record 2025/26 grain production of 376.6 million metric tons and substantial FCI wheat and rice reserves, provides a material domestic cushion. The risk is not famine in India; it is the policy response to rising domestic prices generating global supply-chain disruption.
Pakistan faces a more straightforwardly humanitarian El Niño risk. Below-normal monsoon rainfall, combined with pre-existing economic fragility (IMF program, high debt service costs exceeding 60% of fiscal revenue), limited irrigation system rehabilitation after the 2022 floods, and a rapidly urbanizing population with high food import dependence, creates conditions for acute food price transmission. Pakistan is explicitly listed among the 22 countries in the FAO/WFP Joint Anticipatory Action Appeal.
3.5 Southeast Asia: The September Onset
The primary El Niño impacts in Southeast Asia are expected to materialize from September–October 2026 onward, as the event’s influence on the region’s atmospheric circulation becomes fully established. The June–August period corresponds to the region’s peak wet season in most areas, which typically provides adequate moisture even in El Niño years; the dry-season extension effect becomes dominant from September.
Indonesia faces wildfire risk in peat-rich Sumatra and Kalimantan, where the 2015–16 and 2019 El Niño events triggered transboundary haze events that blanketed Singapore, Malaysia, and southern Thailand and produced estimated regional economic losses of $2–3 billion each. Indonesia’s record public rice reserves (approximately 5 million metric tons as of April 2026) provide a meaningful domestic food security buffer. Philippines rice production faces a projected 5–12% yield reduction based on historical El Niño event composites, and USDA projects Philippine rice imports could rise toward 5.1 million metric tons if domestic production declines materialize.
Vietnam and Thailand face El Niño-driven reduced Mekong River discharge and intensified saline intrusion into the Mekong Delta, the rice bowl of Vietnam that produces approximately 50% of the country’s paddy. Thailand, a major rice exporter, also faces yield risk in its central and northeastern cropping zones. These Southeast Asian production pressures will compound whatever supply stress is generated by South Asian El Niño impacts in the global rice market.
3.6 Central America Dry Corridor: Anticipatory Action Already Activated
The Central American Dry Corridor is the region where the humanitarian response system has advanced furthest in implementing the anticipatory action model in response to the 2026 El Niño. FAO’s Agricultural Stress Index identified the Corridor as a high-priority zone in its initial June 2026 assessment, and the CERF approved a $4 million forecast-based financing disbursement in June 2026 when forecasts confirmed a below-normal June–August 2026 first-season rainfall.
This disbursement followed the first Latin American collective anticipatory drought plan, developed in 2025 by FAO, WFP, UNICEF, IOM, and national governments of Guatemala, Honduras, El Salvador, and Nicaragua, which defined specific meteorological trigger conditions and pre-agreed response activities for each level of rainfall deficit. The plan represents the most operationally advanced anticipatory action framework for El Niño response in any tropical region, and its activation in 2026 is a proof-of-concept for similar systems in the Sahel and Horn of Africa.
The food security baseline in Guatemala, where IPC analysis projects approximately 3 million people (one in six Guatemalans) in IPC Phase 3+ between February and April 2026, reflects both the structural poverty of the Dry Corridor and the residual impacts of prior droughts. White maize prices in Tegucigalpa were running 39% above the five-year average as of early 2026, sharply reducing household purchasing power for the bottom income quintile.
The migration dimension is analytically inseparable from the food security dimension in the Central American Dry Corridor. WFP surveys conducted during prior El Niño events found that 8% of Dry Corridor families explicitly planned to migrate externally as a coping strategy. For families at the margin of IPC Phase 3, the opportunity cost of remaining in a food-insecure community with limited livelihood alternatives is frequently lower than the expected gain from attempting migration, a rational livelihood calculation that no amount of border enforcement can eliminate without addressing the underlying food security condition.
3.7 Caribbean and Haiti: Compound Vulnerability Extreme
Haiti is the most severe food security crisis in the Western Hemisphere and one of the most acute globally. As of the April 2026 IPC analysis: the most recent available, 5.83 million Haitians, representing 52% of the national population, were in IPC Phase 3 (Crisis) or above, including more than 1.8 million in Emergency (IPC Phase 4). An estimated 1.3 million Haitians are internally displaced by armed gang violence, which by 2026 controls approximately 90% of the Port-au-Prince metropolitan area.
Haiti’s analytical position in this report requires a careful statement of causation. The primary drivers of Haiti’s crisis are structural: the combination of political collapse following the July 2021 assassination of President Moïse, the progressive expansion of armed gang territorial control (particularly the G9 coalition and its successor structures), extreme economic fragility (GDP per capita approximately $1,800 at purchasing power parity; formal employment below 15% of the working-age population), and the structural underdevelopment of the agricultural sector (less than 20% of potentially arable land under cultivation due to deforestation, soil erosion, and insecurity). El Niño is a compounding factor, not a primary driver, in Haiti’s case.
El Niño historically suppresses Atlantic hurricane activity by increasing upper-level wind shear over the main development region, a characteristic that, if it holds for 2026, would provide some protection during the June–November 2026 hurricane season. However, this is a probabilistic association, not a guarantee; a single major hurricane landfall in Haiti during an active season would represent a catastrophic additional shock to a system already in near-terminal distress.
3.8 Cross-Regional Vulnerability Synthesis
The seven regional analyses above reveal structural patterns that transcend geography and define the nature of the 2026 El Niño challenge:
Pattern 1: The Compounding Crisis. The 2026 El Niño does not strike neutral or recovered systems. It strikes systems that are still dealing with the fallout of the 2023–24 event (Southern Africa), that have endured three to four consecutive years of agricultural stress (Horn of Africa, Sahel), and that are simultaneously managing active armed conflict (Sahel, Somalia, Sudan, Myanmar). The marginal humanitarian cost of the 2026 event, the additional suffering attributable to El Niño over and above the counterfactual without El Niño, is thus both large in absolute terms and difficult to distinguish from the baseline at the individual household level.
Pattern 2: The Asset Depletion Spiral. Extended droughts destroy the productive asset base of rural households, livestock, equipment, seed stocks, land improvements, which reduces their capacity to recover even when rainfall returns to normal. Each successive El Niño event, therefore, strikes a population with less productive capacity than the previous event did. This progressive asset depletion explains why the 2023–24 “Strong” El Niño produced humanitarian outcomes in Southern Africa comparable to the 2015–16 “Very Strong” event: the population’s capacity to absorb shock had deteriorated, not improved, in the intervening decade.
Pattern 3: The Urban Transmission Vector. El Niño’s agricultural impacts are typically analyzed in terms of rural households and subsistence farmers. Increasingly, however, they reach urban populations through food price transmission. African cities that have grown rapidly in the past two decades have large populations of urban poor whose food expenditure constitutes 50–70% of household income. A 30–40% increase in staple food prices, well within the range produced by previous strong El Niño events, can push millions of urban poor into acute food insecurity that is both more politically salient and more difficult to reach with agricultural support programs than rural food insecurity.
Pattern 4: The Governance Interaction. The regions most exposed to El Niño’s agricultural teleconnections are disproportionately governed by states with limited fiscal capacity, constrained institutional effectiveness, and in some cases active domestic political crises (military governments in Mali, Burkina Faso, Niger; civil war in Sudan; political instability in Zimbabwe) that reduce the government’s ability and political incentive to prioritize food security programming. The international community’s ability to fill this governance gap through humanitarian assistance is, in turn, constrained by the worst funding environment in a decade.
CHAPTER 4
4. Global Food Price Dynamics and Commodity Markets
4.1 Market Baseline: Relative Calm Before the Storm
The global food commodity market environment in June–July 2026 presents a paradox that requires careful interpretation. By the headline indicator, the FAO Food Price Index (FPI), the most widely cited composite measure of international food commodity prices, markets appear broadly stable and well-supplied. The June 2026 FPI averaged 130.3 points (2014–2016 = 100), only 2.2% above its year-earlier level and fully 18.4% below the historical peak of 159.7 reached in March 2022 in the aftermath of Russia’s invasion of Ukraine. Global cereal production for 2026 is forecast at 2,983 million metric tons, the second-highest on record despite being 1.9% below 2025’s historical maximum. The global cereal stock-to-use ratio: the most important single indicator of medium-term price risk, remains a comfortable 32%, well above the 20–25% levels that have historically preceded acute price crises.
This comfortable aggregate picture masks substantial commodity-specific and region-specific divergences that are both currently visible and likely to intensify as El Niño peak impacts materialize. Three commodity sub-indices in the June 2026 FPI release are already moving in the direction that El Niño risk analysis would predict: the FAO All Rice Price Index rose 3.2% month-on-month; vegetable oils (primarily palm oil) rose 3.8%; and sugar fell only modestly (–5.7%) from elevated levels, with market participants noting El Niño-related concerns for the 2026/27 Indian and Thai cane crops as a support factor.
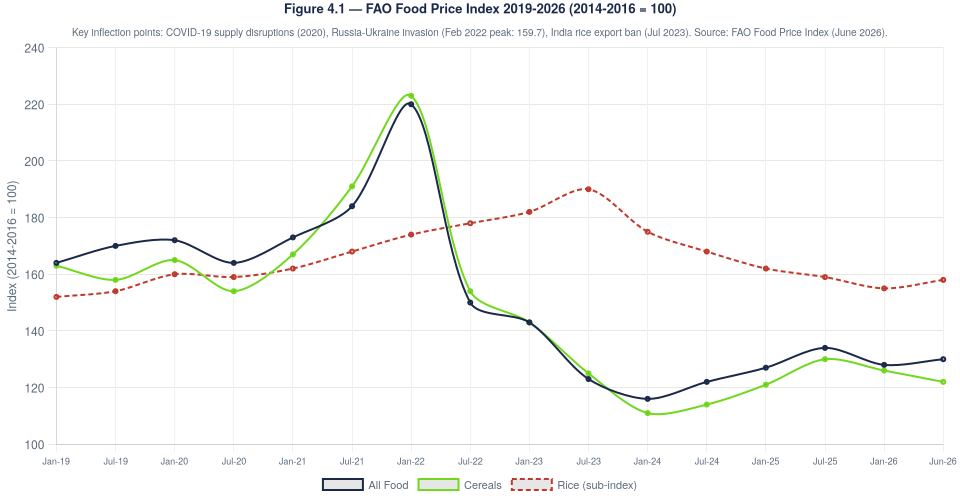
Figure 4.1: FAO Food Price Index 2019–2026 (2014–2016 = 100). All Food (navy), Cereals (green), Rice sub-index (red dashed). Key inflection points: COVID-19 supply disruptions (2020); Russia-Ukraine invasion (February 2022 peak: 159.7); India rice export ban (July 2023). Source: FAO Food Price Index, monthly releases 2019–June 2026.
4.2 Rice: The Primary El Niño Commodity Risk
Rice is, by serious margin, the most El Niño-sensitive of the globally traded staple cereals. The combination of India’s dual role as the world’s largest rice exporter (approximately 40% of global trade) and one of the El Niño’s primary agricultural impact zones, combined with the geography of other major rice exporters (Thailand, Vietnam, Myanmar) in El Niño-sensitive Southeast Asia, means that any strong El Niño event creates simultaneous supply pressure across the dominant suppliers to the global rice market.
The 2023 precedent is analytically essential. India’s July 20, 2023 ban on non-basmati white rice exports, motivated by a below-normal monsoon in June–July 2023 and rising domestic rice prices, removed approximately 10 million metric tons of annual export supply from global markets with less than 24 hours’ notice. The FAO All Rice Price Index responded by reaching its highest level since 2011 within six weeks. Some Indica benchmark prices (Thai 5% broken rice, the primary reference for the African and Middle Eastern import market) rose by up to 40% between July and November 2023, before progressively easing as it became clear that Indian production would not fall as severely as feared and as India progressively lifted restrictions through late 2024.
The structural conditions in 2026 that could trigger a repetition of this episode are: a confirmed below-normal Indian monsoon (currently forecast at 90% of LPA, below-normal by definition); politically sensitive domestic rice price inflation ahead of potential regional elections; and a government that has already demonstrated willingness to prioritize domestic price management over export market stability. The political economy of rice price management in India, where food price inflation is one of the most electorally sensitive issues, creates structural incentives for defensive trade policy that the formal G20 commitment to avoiding export restrictions (under the AMIS framework) has not consistently been able to override.
The World Bank’s June 2026 Commodity Markets Outlook assigned a 61–87% probability of a “strong or very strong El Niño emerging by mid-2026” and found that this scenario could cut rice output by 20–50% in the most affected regions of South Asia, Southern Africa, and parts of East Asia. This range is wide enough to encompass outcomes from moderate market stress to severe global price crisis; the key swing variables are the Indian monsoon trajectory and the Government of India’s trade policy response.
Adding to the complexity: the current global rice market is actually well-supplied by historical standards. After the 2023 crisis, India’s 2024/25 rice harvest was strong, restrictions were lifted, and both Thailand and Vietnam ramped up exports, creating a global surplus that has kept prices below their 2023 peak. This surplus functions as a buffer, but one whose effectiveness depends on it remaining intact rather than being reabsorbed into national strategic reserves if El Niño-related concerns intensify trade policy anxiety.
4.3 Wheat: Resilient But Not Immune
Wheat markets are currently well-supplied, with the June 2026 FAO Wheat Price Index falling 4.4% month-on-month on strong Black Sea export competition from Ukraine and Russia. El Niño’s wheat exposure operates through two geographically distinct channels: Australian winter wheat (planted May–June, harvested November–December) faces below-normal rainfall risk in the southern grain belt of Western Australia, South Australia, and Victoria, zones that are highly sensitive to the El Niño dry signal; and Indian wheat faces risk from sub-optimal monsoon conditions that reduce soil moisture ahead of the rabi (winter-sown) planting season in October–November.
Australia is the world’s fifth-largest wheat exporter and a critical supplier to Middle Eastern and Southeast Asian markets. The 2002–03 and 2019 El Niño events both produced major Australian wheat production shortfalls (–37% and –27% respectively in the most affected seasons). The 2026/27 Australian wheat crop (planted in May–July 2026) will develop in conditions of confirmed El Niño influence on the southern grain belt from approximately September onward. IMF and FAO forecasters currently project Australian wheat production at approximately 24 million metric tons for 2026/27, down from 28 million in 2025/26, reflecting the El Niño risk. This reduction is not catastrophic at the global scale given abundant Northern Hemisphere wheat supplies, but it narrows the global buffer for price shock absorption.
4.4 Sugar, Palm Oil, and Cocoa: High-Sensitivity Commodities
Three commodity markets beyond the major cereals face particularly elevated El Niño exposure: sugar (through India and Thailand’s cane crops), palm oil (through Indonesia and Malaysia’s dry-season production), and cocoa (through West Africa’s climate sensitivity).
Global sugar markets experienced material price volatility in 2023–24 partly due to El Niño concerns about India’s cane production, which is highly sensitive to the southwest monsoon. A repeat of a below-normal Indian monsoon in 2026, combined with concerns about the 2026/27 Thai cane crop and reduced crushing season throughput, represents a meaningful upside price risk for sugar markets that are already recovering from the 2023 spikes.
Palm oil, of which Indonesia and Malaysia together supply approximately 85% of global traded volumes, faces reduced production risk from the dry-season extension associated with El Niño in the Maritime Continent. Historical El Niño events have reduced Indonesian palm oil output by 5–15% in the following year, with a lag of approximately 12–18 months from the meteorological event to the production impact (reflecting palm oil’s delayed phenological response). A strong 2026 El Niño would thus be expected to reduce Indonesian palm oil production in approximately 2027, compounding the immediate price pressure from wildfire-related operational disruptions in 2026.
West African cocoa, produced primarily in Côte d’Ivoire (approximately 40% of global output) and Ghana (approximately 20%), has been in a multi-year crisis since the 2022–23 season due to drought, disease (cocoa swollen shoot virus), and aging tree stock. A below-normal 2026 Sahel monsoon extends drought pressure into the cocoa-growing zones of the humid forest margins, further stressing production capacity in countries that are already responding to historically high cocoa prices driven by supply deficit. The structural dynamics of the West African cocoa supply chain, which would require 5–7 years of investment in replanting and disease management to recover even under favorable conditions, mean that El Niño’s 2026 contribution to the cocoa supply shortfall is likely to persist well beyond the event itself.
4.5 Trade Policy Risk: The Export Restriction Contagion
One of the most important (and most systematically underestimated) mechanisms by which El Niño transmits to global food insecurity is the cascade of export restrictions that major producing countries implement to protect domestic consumers when production is threatened. This mechanism was extensively documented during the 2007–08 food price crisis (when approximately 30 countries implemented export restrictions), during the COVID-19 pandemic (when more than 20 countries restricted food exports in 2020), and most recently during the 2023 India rice ban.
The fundamental problem with export restrictions is that they are nationally rational in isolation and globally destructive in aggregate. When India bans rice exports to protect domestic consumers from rising prices, the immediate domestic effect is to stabilize prices for Indian consumers. The immediate international effect is to remove supply from global markets precisely when demand is rising, amplifying the price spike for importing countries, often the most food-insecure countries that can least afford the additional cost. When multiple countries implement restrictions simultaneously, the amplification effect is multiplicative.
The formal institutional framework for preventing export restriction contagion is the G20 Agricultural Market Information System (AMIS), established in 2011 following the 2010–11 food price crisis. AMIS provides near-real-time monitoring of global supply and demand for the four major traded cereals and coordinates policy dialogue among G20 agricultural ministers. However, AMIS’s authority is purely advisory; it has no legal standing to prevent member states from implementing export restrictions, and its track record in preventing the India 2023 ban, despite India’s formal participation in AMIS governance, demonstrates the limits of non-binding coordination mechanisms when domestic political pressures are sufficiently intense.
ISDO recommends, in the Policy Recommendations chapter, that the G7 and G20 convene an emergency agricultural trade ministers’ meeting before November 2026 to secure a collective standstill declaration against staple food export restrictions, with explicit acknowledgment that the 2023 India precedent has made the AMIS framework’s informal norms insufficient as a crisis prevention mechanism. The legal instrument best suited to formalizing such a commitment remains under debate in WTO/agricultural trade circles, but the political commitment is achievable and worth pursuing regardless of the legal mechanism.
4.6 Historical Price Analysis: Three Event Comparisons
| El Niño Event | Niño 3.4 Peak | Peak Global Rice Price Change | Peak Global Wheat Price Change | Peak Global Maize Price Change | Key Trigger Mechanism |
| 1997-98 | +2.4°C | +22% (Thai Indica) | +28% (Chicago) | +24% | SE Asia drought; Indonesia fires; Australia shortfall |
| 2015-16 | +2.3°C | +8% (moderate; USD strong) | +5% (minimal) | +12% | Southern Africa maize deficit; Australia shortfall; Black Sea oversupply limited spike |
| 2023-24 | +1.9°C | +40% (Indica Jul–Nov 2023) | +3% (Black Sea supply absorbed) | +8% | INDIA RICE EXPORT BAN (Jul 2023): primary market mechanism; underlying India monsoon deficit moderate |
| 2026 (Scenario B) | +1.6°C (est.) | +15–25% projected | +5–12% projected | +12–22% projected | India below-normal monsoon; SE Asia dry season; SA maize deficit; potential India policy response |
| 2026 (Scenario C) | +2.0°C+ (est.) | +30–45% projected | +10–20% projected | +20–35% projected | Multiple simultaneous supply shocks; India ban probable; SE Asia production collapse; SA emergency imports |
Table 4.1: Historical and projected food commodity price changes during major El Niño events. Historical figures represent peak changes from pre-event baseline to event peak. 2026 projections represent ISDO central estimate ranges under Scenarios B and C. Sources: FAO Food Price Index, NOAA, World Bank Commodity Markets Outlook, historical commodity trade databases.
4.7 Fertilizer and Input Cost Compounding Factors
Food commodity price analysis that focuses exclusively on end-product prices misses a second mechanism by which El Niño affects food security: the impact on input costs, particularly fertilizers, and the resulting effect on planting decisions and yield per hectare in the following season.
The World Bank projects global fertilizer prices to rise approximately 31% on average in 2026, reaching their least affordable levels since the 2021–22 crisis that preceded the Ukraine invasion. The drivers include: elevated natural gas prices (the primary feedstock for nitrogen fertilizer); higher ammonia prices linked to Middle East conflict impacts on production in Egypt and other regional producers; increased freight costs; and supply concentration in producers subject to geopolitical risk (Russia, Belarus, China). A strong El Niño that reduces agricultural income in affected regions, particularly in Sub-Saharan Africa and South Asia, simultaneously reduces farmer ability to purchase inputs for the following season, compounding the direct yield loss of the El Niño event itself with reduced fertilizer application that constrains the recovery season’s productivity.
This input-cost channel is one of the mechanisms through which Callahan and Mankin (2023) found that El Niño’s economic impacts are “persistent” rather than transient: the damage to agricultural productivity in year one of the event cycle reduces fertilizer use, seed quality investments, and equipment maintenance in the following season, creating a multi-year productivity depression that outlasts the meteorological event by three to five years.
CHAPTER 5
5. Forced Displacement and Migration
5.1 Conceptual Framework: Climate, Drought, and Human Mobility
The relationship between climate shocks and human migration occupies one of the most contested intersections of environmental science, political geography, and policy analysis. Three well-documented analytical cautions must frame any quantitative treatment of this subject.
First, the climate-migration relationship is multi-causal and context-dependent. No study in the peer-reviewed literature has found a direct, single-cause link between drought or temperature anomalies and migration rates at the household level; every well-designed study finds that the effect of climate shocks on migration is mediated by pre-existing economic conditions, social networks, governance quality, and the availability of non-migration coping strategies (Adams, 2020, Journal of Peasant Studies; Black et al., 2011, Global Environmental Change). Put plainly: El Niño does not produce migration mechanically; it increases the probability of migration by reducing the relative attractiveness of non-migration coping strategies.
Second, internal displacement dominates over cross-border migration. The dominant pattern of climate-related human movement in El Niño events is internal displacement, movement within national borders, typically from drought-affected rural areas to urban centers, secondary towns, or areas with access to irrigation or food assistance. Cross-border migration, while material in humanitarian and political terms, constitutes a smaller fraction of total climate-related mobility and is typically preceded by exhaustion of internal coping options.
Third, migration is often an adaptation strategy rather than a failure mode. For many households in the Sahel, the Horn, and Central America, seasonal or long-distance migration is an established component of the livelihood portfolio, a strategy for income diversification that pre-dates El Niño by generations. El Niño accelerates, extends, and in some cases permanently transforms these existing migration patterns, but it does not create them from a neutral baseline. The analytical question is not “does El Niño cause migration?” but “how does El Niño modify the volume, destination, duration, and demographic composition of existing mobility patterns?”
5.2 Displacement Data: The 2026 Baseline
IOM’s Displacement Tracking Matrix (DTM): the most wide-ranging operational system for monitoring conflict and disaster displacement globally, provides the most current quantitative baseline available at the time of writing. The June 2026 DTM data reveals several patterns that will be amplified by the El Niño event:
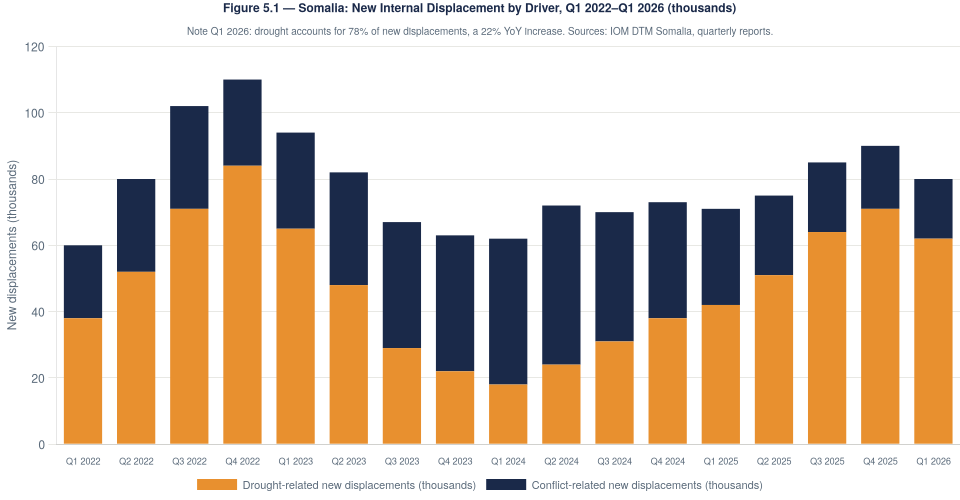
Figure 5.1: Somalia: New Internal Displacement by Driver, Q1 2022–Q1 2026 (thousands). Orange = drought-related; navy = conflict-related. Note Q1 2026: drought accounts for 78% of new displacements, a 22% year-on-year increase. IOM DTM records approximately 62,000 new drought-induced displacements in early 2026 across five Somali districts alone. Source: IOM DTM Somalia Quarterly Displacement Tracking Reports, 2022–2026.
The Somalia pattern, where drought already accounts for three of every four new displacements before the El Niño peak, is the most acute documented case but not an outlier. Analogous trends are documented in Ethiopia (Somali and Oromia regions), northwest Nigeria, Burkina Faso (where 2.2 million people are internally displaced by the combination of conflict and drought), and southern Malawi.
UNHCR’s Global Trends in Forced Displacement 2025 (the most recent annual assessment available) documented a record 117.3 million forcibly displaced people globally at end-2025, of whom approximately 63.3 million were internally displaced persons (IDPs). Climate and disaster displacement accounted for approximately 26.4 million new internal displacements in 2025, the highest annual figure ever recorded, with drought-related displacement accounting for approximately 38% of the climate/disaster total. El Niño 2026 will drive a further increase in this already-record baseline.
IOM’s early 2026 projection for Somalia alone, nearly 125,000 additional drought displacements expected in Q2 2026 under assumptions of near-normal Gu (long rains), provides a sense of the scale of new displacement that the El Niño-driven long-rain deficit is likely to produce. Extrapolating this projection across all seven regions analyzed in Chapter 3, and acknowledging that the Q2 2026 projection predates the confirmed El Niño signal and the expected June–September monsoon deficit, the total incremental climate displacement attributable to the 2026 event could reach several million people across the Sahel, Horn, and Southern Africa combined by March 2027.
5.3 Cross-Border Migration Corridors: Detailed Analysis
5.3.1 The Sahel-to-Mediterranean Corridor
As extensively documented in the companion ISDO report on irregular immigration from the Sahel to Spain (Security & Intelligence Department, July 2026), the Sahel-to-Mediterranean corridor is the most geopolitically serious migration route in the 2026 context. Spain received 64,019 irregular arrivals by sea in 2024, a historical record, with Malians (23.8%), Senegalese (18.5%), and Guineans (~8.6%) the largest nationality groups. The corridor operates through two axes: the Atlantic Route (Ruta Canaria) connecting West African coastal states to the Canary Islands, and the Central Mediterranean Route through Libya and Tunisia.
El Niño’s impact on this corridor operates through the structural push factors that drive Sahelian outmigration: agricultural income collapse, livestock loss, food price inflation, and the progressive destruction of livelihoods in conflict-affected zones. An El Niño-driven monsoon deficit in June–August 2026 that damages the 2026/27 harvest in Mali, Senegal, Burkina Faso, and Niger will, with a 6–12 month lag reflecting the agricultural calendar and the time required to exhaust internal coping strategies, increase the pool of economically desperate young men for whom the opportunity cost of attempted migration falls to the level where it appears worth the risk.
The policy interaction effect documented in the companion ISDO report is analytically important: the Spain-Mauritania-Senegal bilateral agreements of 2024–25 reduced Canary Islands arrivals by approximately 63%, but simultaneously produced a 42% increase in Balearic arrivals (Algerian-Balearic route) and an extension of the Atlantic route toward Guinea-Conakry. A strong El Niño intensifying structural push factors while bilateral border management agreements remain in place will likely drive flows toward these longer, more dangerous alternative routes, increasing mortality rates without reducing overall migration pressure.
5.3.2 The Horn of Africa Corridor
The Horn of Africa migration corridor feeds into three destinations: the Arabian Peninsula via the Gulf of Aden (the Eastern Route, primarily from Somalia and Ethiopia); East and Southern Africa via Tanzania and Mozambique; and North Africa via Sudan and Libya (connecting with the Central Mediterranean Route). El Niño’s impact on this corridor operates primarily through drought-induced livelihood collapse in Somali pastoral communities and Ethiopian highland farming systems, combined with the well-documented relationship between food insecurity and Al-Shabaab recruitment (discussed in Chapter 6) that can convert climate-driven economic desperation into conflict-driven displacement.
The Sudan collapse adds a compounding dimension to the Horn corridor that is without precedent in recent history. Sudan has historically served as a transit country for migrants from Ethiopia and Eritrea moving toward Libya and Europe; the civil war that began in April 2023 has simultaneously produced 8+ million internally displaced Sudanese and disrupted the transit infrastructure that supported regional migration movements. The humanitarian consequences for Sudanese civilians are severe; the spillover effects for regional migration systems are material but poorly documented due to access limitations.
5.3.3 The Central America-United States Corridor
The relationship between El Niño and migration in the Central America-to-US corridor is supported by stronger direct evidence than the Sahel or Horn corridors, because WFP has conducted direct survey research on migration intentions among food-insecure Dry Corridor households during previous El Niño events. Key findings from WFP’s 2016 survey (conducted during the 2015–16 El Niño): 8% of surveyed Dry Corridor households reported plans to migrate externally; approximately 80% of those planning to migrate cited food insecurity and insufficient income as primary or secondary motivating factors.
The migration-food security relationship in the Dry Corridor is characterized by what Fransen and Kuschminder (2012, Journal of Ethnic and Migration Studies) termed the “migration hump”: as income falls, migration initially increases as households invest the last of their resources in the migration journey, then falls if income falls below the minimum threshold required to finance migration at all. Households in IPC Phase 3 are near or above this migration threshold; households in IPC Phase 4 may be below it. This implies that El Niño’s impact on migration is not linear: moderate food insecurity intensification may increase outmigration more than severe intensification.
For the 2026 event, the relevant population is approximately 3 million Guatemalans already in IPC Phase 3+ (February–April 2026), a pool from which even a modest increase in the fraction considering migration translates into tens of thousands of additional households attempting the northward journey. The CERF $4 million anticipatory action disbursement in June 2026 is calibrated to reach approximately 50,000 of the most vulnerable households; the remaining 2.95 million remain entirely outside the coverage of funded anticipatory assistance.
5.4 Vulnerable Population Profiles
Not all populations exposed to El Niño-driven drought are equally likely to migrate, and understanding the differential vulnerability profile matters for both humanitarian targeting and migration-management policy. Key vulnerable population profiles in the 2026 El Niño context:
- Pastoralist and agropastoralist households (Sahel, Horn, Eastern Africa): These households have the highest climate-migration susceptibility because their livelihood is entirely dependent on mobile livestock systems that are directly exposed to El Niño-driven pasture and water depletion. Livestock price collapse during distress-sale periods reduces the financial resources available for non-migration coping, while the destruction of herd assets eliminates the productive base for recovery. Pastoralist migration in El Niño years is typically characterized by rapid, long-distance movement in search of pasture, movement that crosses national borders more readily than for settled agriculturalists.
- Small-scale rain-fed farmers in marginal zones (Central America Dry Corridor, Sahel fringe, Southern Africa dryland areas): These households have limited or no access to irrigation, depend on single-season rain-fed production for 70–90% of their caloric intake, and have minimal non-farm income buffers. A single season of crop failure can eliminate household food reserves, force distress sales of productive assets, and initiate a debt spiral (often from moneylenders at 30–60% monthly interest) that makes continued agricultural investment non-viable. Young adult men in these households are typically the first to migrate as a diversification strategy; prolonged El Niño events can convert temporary labor migration into permanent displacement.
- Urban poor in affected cities (secondary cities in the Sahel, Horn, and Southern Africa): Urban food insecurity, transmitted through food price inflation rather than direct agricultural exposure, is increasingly documented as a driver of urban-to-urban or urban-to-rural displacement. In some cases, urban residents return to villages of origin during food crises, inverting the rural-urban migration direction. In others, they migrate to larger cities in search of social protection or food assistance. Both patterns have implications for urban service delivery and social cohesion in destination cities.
- Children and adolescents (all regions): El Niño-driven food insecurity is a major driver of child school dropout, both because families cannot afford school fees and because children are needed for income-generating activities (including herding, agricultural labor, and household tasks freed up by parental absence). The NEET (Not in Education, Employment, or Training) rates among young people in El Niño-affected zones have historically spiked during and after severe events, creating a long-term human capital consequence that extends well beyond the event’s meteorological duration.
5.5 2026-2027 Migration Scenarios
In the absence of adequate anticipatory action, ISDO projects the following migration-related outcomes for the 2026–2027 El Niño cycle, differentiated by scenario:
Under Scenario B (Strong El Niño, peak +1.5–1.9°C): New drought-induced internal displacement of approximately 8–12 million people across the Sahel, Horn of Africa, and Southern Africa combined, with a peak in the October 2026–March 2027 period. Cross-border migration pressure along the Sahel-Mediterranean corridor increases by approximately 20–35% above the 2025 baseline, primarily through the Central Mediterranean and Balearic routes following reinforcement of West African bilateral agreements. Central America-US corridor increases by approximately 10–15%.
Under Scenario C (Very Strong El Niño, peak ≥ +2.0°C): New drought-induced internal displacement of approximately 15–22 million people, with concentrated Emergency (IPC Phase 4) conditions driving accelerated displacement from Zambia, Zimbabwe, Malawi, and across the Sahel belt. Cross-border migration pressure along the Sahel-Mediterranean corridor increases by 35–55% above 2025 baseline. Central America-US corridor increases by 25–40%, representing a potential additional 150,000–250,000 irregular border crossing attempts above the 2025 baseline.
CHAPTER 6
6. Security and Conflict Nexus
6.1 Empirical Foundation: Thirty Years of Research
The academic literature on climate and conflict has expanded dramatically since the 1990s, from a relatively small body of theoretical argument to a now-substantial empirical literature involving multiple research groups, methodological approaches, and geographic scopes. This section reviews the most relevant findings for the El Niño-conflict nexus, beginning with the landmark Hsiang, Meng & Cane (2011) study and tracing the subsequent methodological debates and evidentiary accretions.
6.1.1 The Foundational Study: Hsiang, Meng & Cane (2011)
The study “Civil conflicts are associated with the global climate” (Hsiang, Meng & Cane, Nature, Volume 476, August 25, 2011) remains the most cited piece of evidence in the El Niño-conflict literature. Using a dataset of 175 countries and 234 conflicts between 1950 and 2004, Hsiang et al. found that the annual probability of new civil conflict onset in the tropics approximately doubled in El Niño years relative to La Niña years, from roughly 3% to 6%. They associated ENSO variations with “approximately 21% of all civil conflicts since 1950.” The study’s credibility rests in large part on its causal identification strategy: ENSO is plausibly exogenous to the confounders that typically plague conflict research (poverty, ethnic heterogeneity, political institutions), allowing the authors to use it as an instrumental variable for climate stress.
“ENSO may have had a role in 21% of all civil conflicts since 1950… We suggest that when crops fail and economic hardship increases, the probability of civil war onset increases. … The role of climate in conflict may have been underappreciated.”
— Hsiang, S.M., Meng, K.C., and Cane, M.A. (2011). Civil conflicts are associated with the global climate. Nature, 476, 438–441.
6.1.2 Subsequent Literature: Refinements and Debates
The Hsiang et al. (2011) findings have been subject to substantial methodological scrutiny, which has refined rather than overturned the core finding. Key subsequent studies include:
- Klomp & Bulte (2013, Journal of Conflict Resolution): A direct replication that found the ENSO-conflict relationship to be sensitive to methodological choices, particularly the definition of conflict (onset vs. incidence), the time period analyzed, and the inclusion of country fixed effects. They concluded that the relationship is “fragile” in the sense that small analytical choices change the estimated effect size, but did not conclude that no relationship exists.
- Landis (2014, Journal of Peace Research): Extended the analysis to show that the ENSO-conflict correlation is stronger in countries with higher dependence on rain-fed agriculture and weaker state institutions, consistent with the proposed economic stress mechanism.
- Burke et al. (2015, Annual Review of Economics): A wide-ranging meta-analysis of 55 studies found that “one standard deviation increases in temperature or rainfall changes increase the frequency of interpersonal conflict by 2.4% and intergroup conflict by 11.3%.” The meta-analytic finding substantially exceeds the Hsiang et al. point estimate, though with wide confidence intervals.
- von Uexkull et al. (2016, PNAS): Demonstrated that the drought-conflict link is mediated by agricultural dependence and ethnopolitical exclusion, and is concentrated in areas where conflict-prone groups are economically marginalized.
The preponderance of evidence in this literature, subject to the cautions noted in Chapter 1, supports the following analytical conclusions: (1) El Niño is associated with elevated conflict risk in the tropics; (2) the relationship operates through economic stress (food prices, agricultural income) rather than through resource competition or environmental degradation directly; (3) the effect is substantially stronger in countries with high agricultural dependence, weak institutions, and pre-existing political exclusion of key social groups; and (4) the effect size is probabilistic and modest in absolute terms, from 3% to 6% annual probability of new conflict onset, but consequential given the large number of exposed countries.
6.2 The Sahel: The Most Acute Convergence Zone
No region on Earth combines El Niño agricultural exposure, active jihadist insurgency, institutional collapse, and great-power military competition more acutely than the central and western Sahel. The region has experienced one of the most rapid deteriorations in human security in modern history since 2020, and the 2026 El Niño arrives at what multiple security analysts assess as the most dangerous inflection point in that deterioration.
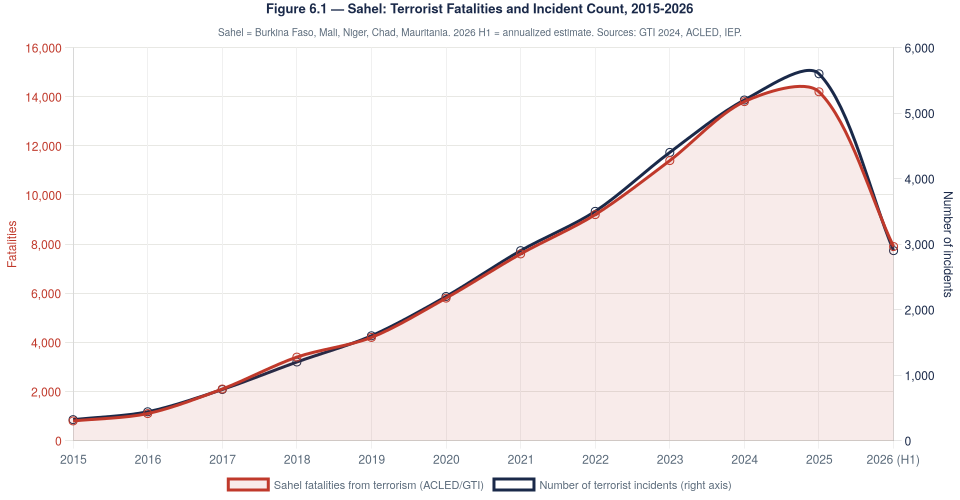
Figure 6.1: Sahel: Terrorist Fatalities and Incident Count, 2015–2026. Red shaded area = fatalities (left axis); navy line = number of incidents (right axis). Note the near-linear increase in both metrics since 2017, with the Sahel accounting for approximately 47% of global terrorism deaths in 2023 and ranking Mali and Burkina Faso first and third globally for terrorist activity in 2024. Source: Institute for Economics and Peace, Global Terrorism Index 2024; ACLED.
6.2.1 JNIM: Strategy, Capacity, and Climate Exploitation
JNIM (Jamaa Nusrat ul-Islam wa al-Muslimin) is the primary Al-Qaeda affiliate in the Sahel, formed in March 2017 through the merger of Ansar Dine, the Macina Liberation Front, Al-Mourabitoun, and the AQIM Sahara Emirate. By mid-2026, JNIM controls approximately 40,000 square kilometers of territory in Mali, Burkina Faso, and parts of Niger (an area roughly the size of Switzerland) and launches approximately 35–40 attacks per week across the region. The group has demonstrated increasing sophistication in financial management, territorial governance, and strategic communication.
JNIM’s exploitation of climate vulnerability follows a documented strategic logic that has been analyzed by the Tony Blair Institute for Global Change (2024), ACLED researchers, and UN Panel of Experts reports. The key mechanisms are:
- Water infrastructure control: JNIM has deliberately targeted and destroyed boreholes, water pumping stations, and irrigation infrastructure in contested areas, creating water scarcity that increases civilian dependence on JNIM-controlled water sources. The Tony Blair Institute documented a 40% increase in deliberate water infrastructure attacks by armed groups in the Sahel between 2019 and 2024.
- Food provision as territorial governance: In areas under JNIM influence, the group positions itself as an alternative provider of food assistance, distributing grain and livestock in exchange for compliance, information, and in some cases the renunciation of government ties. This “competitive service provision” strategy has been documented in the Liptako-Gourma tri-border zone and in parts of Burkina Faso’s Centre-Nord and Boucle du Mouhoun regions.
- Taxation of agricultural production: JNIM levies taxes on agricultural harvests, livestock, and market transactions in territories it controls or influences. During drought years, these taxes become a mechanism of extreme extraction, imposing a fixed burden on a sharply reduced harvest, that worsens food security outcomes for farmers while funding JNIM operations.
- Recruitment from the drought-displaced: JNIM recruitment has historically been concentrated among young men whose agricultural livelihoods have collapsed, who are displaced from their communities, and who have limited alternative income-generating opportunities. An El Niño-driven monsoon deficit that destroys the 2026/27 Sahel harvest would expand this recruitment pool by several million potential members, making it the single most important security consequence of the 2026 event in the region.
6.2.2 IS-Sahel: Territorial Competition and Violence Escalation
IS-Sahel (the Islamic State in the Greater Sahara, also known as ISGS) operates primarily in the tri-border area of Mali, Burkina Faso, and Niger, where it competes with JNIM for territorial control, financial resources, and recruits. Unlike JNIM’s relatively gradual expansion strategy, IS-Sahel is characterized by higher operational tempo and more indiscriminate violence against civilians, including deliberate targeting of ethnic minority communities accused of collaborating with state or anti-jihadist forces. The inter-group competition between JNIM and IS-Sahel has paradoxically intensified violence in areas where neither group has achieved dominance, as both compete for resources and recruits in an increasingly constricted operational environment.
El Niño’s impact on IS-Sahel dynamics operates similarly to its impact on JNIM but with a specific additional dimension: IS-Sahel’s primary source of civilian support has historically been among communities of Tuareg and Fulani pastoralists whose traditional land use and seasonal migration routes have been disrupted by conflict. An El Niño-driven degradation of pasture and water resources would increase conflict between these communities and settled farmers over access to common resources, a conflict type that IS-Sahel has consistently exploited as an entry point for recruiting community members against their “enemies” (neighboring farming communities, state security forces).
6.2.3 The Security Architecture Vacuum
The withdrawal of French forces from Mali (Operation Barkhane, completed August 2022), Burkina Faso (Operation Sabre, January 2023), and Niger (following the July 2023 coup and subsequent French expulsion) has created a security architecture vacuum that no available force is capable of filling with equivalent capacity or legitimacy. The Russian forces and Wagner/Africa Corps contractors that have replaced French forces in Mali and Burkina Faso have demonstrated: limited capacity for the complex, population-centric counterinsurgency required to dislodge jihadist territorial control; no developmental mandate that would address the governance and economic grievances underlying jihadist recruitment; and a documented pattern of human rights violations that has further alienated civilian populations from the state security apparatus.
MINUSMA (the UN Multidimensional Integrated Stabilization Mission in Mali) was terminated in December 2023 following the junta’s demand for its withdrawal. No replacement multilateral force has been deployed. The ECOWAS military framework is operationally constrained by the political tensions generated by the three Sahelian military governments’ suspension from ECOWAS. The net result is a security vacuum in which jihadist groups can expand with substantially reduced counterterrorism pressure, precisely at the moment when the 2026 El Niño is expected to sharply expand the pool of economically vulnerable young men from which they recruit.
6.3 Horn of Africa: Al-Shabaab and the Drought-Governance Nexus
Al-Shabaab, designated a terrorist organization by the United States, the European Union, and the United Nations, controls approximately 40% of rural southern Somalia as of mid-2026 and maintains serious influence in Hirshabelle, Jubaland, and southwestern Puntland. The organization’s operational model in drought contexts follows a well-documented pattern: targeted attacks on humanitarian convoys and NGO infrastructure to prevent government-aligned food assistance from reaching drought-affected communities, followed by Al-Shabaab food distribution in those same communities to build civilian compliance and information networks.
The Federal Government of Somalia and AMISOM/ATMIS forces have made documented territorial gains against Al-Shabaab since 2022 (Operation Black Lion and subsequent campaigns), recovering large stretches of the Shabelle River valley and parts of Middle and Lower Shabelle regions. However, these gains are fragile and contested, and Al-Shabaab retains the capacity to interdict humanitarian supply lines and conduct both guerrilla and mass-casualty attacks in major urban centers. A strong El Niño drought that intensifies the displacement of rural populations toward urban areas, where Al-Shabaab’s organizational presence is less dominant, could paradoxically reduce Al-Shabaab’s near-term grip on rural populations while creating new security challenges in receiving cities.
6.4 State Fragility and Institutional Capacity Analysis
A consistent finding in the climate-conflict literature is that state institutional capacity is a material moderating variable: countries with stronger governance are less likely to experience conflict escalation during climate shocks, even when they are equally exposed to the meteorological event (Fearon & Laitin, 2003, American Political Science Review; Hendrix & Salehyan, 2012, Journal of Peace Research). This finding has direct policy implications for the 2026 El Niño: institutional capacity investments are simultaneously climate resilience investments and conflict prevention investments.
| Country / Region | Fragile States Index 2025 (rank / 179) | Government Effectiveness (World Bank 2025, percentile) | El Niño + Conflict Interaction Risk | Primary Risk Pathway |
| Mali | 7th most fragile | 3rd percentile | CRITICAL | JNIM territorial control + drought + post-coup institutional collapse + Wagner forces |
| Burkina Faso | 9th most fragile | 2nd percentile | CRITICAL | 72/145 communes with restricted access; JNIM + IS-Sahel + RSP factional violence |
| Somalia | 2nd most fragile | 0th percentile | CRITICAL | Al-Shabaab control of ~40% rural south; drought displacement toward cities; maritime piracy resurgence risk |
| Sudan | 3rd most fragile | 1st percentile | CATASTROPHIC | Active civil war (SAF vs RSF); 33.7M in need; El Niño rainfall deficit on zero-capacity government |
| Niger | 14th most fragile | 5th percentile | VERY HIGH | Post-coup Western force withdrawal; JNIM infiltration of western Niger; Agadez migration hub instability |
| Nigeria (NE/NW) | 15th nationally (subnational) | 12th percentile (national) | VERY HIGH | ISWAP/Boko Haram in NE; farmer-herder conflict in Middle Belt; drought exacerbating resource competition |
| Zimbabwe | 48th most fragile | 9th percentile | HIGH | El Niño + fiscal crisis + political fragility post-Mnangagwa; risk of food-insecurity-driven urban unrest |
| Zambia | 66th most fragile | 22nd percentile | MODERATE | El Niño + debt distress + hydropower collapse; risk of economic disruption rather than conflict per se |
Table 6.1: State fragility and El Niño-conflict interaction risk by country. Fragile States Index: Fund for Peace (2025). Government Effectiveness percentile: World Bank Worldwide Governance Indicators (2025). Risk rating reflects ISDO assessment of El Niño-conflict interaction risk, not baseline conflict risk. Sources: Fund for Peace, World Bank WGI, ACLED, ISDO analysis.
6.5 Conflict Escalation Scenarios for 2026-2027
Extrapolating from the empirical literature (Hsiang et al., 2011; Burke et al., 2015), the regional vulnerability analysis, and the specific operational patterns of armed groups in the Sahel and Horn, ISDO identifies the following conflict escalation scenarios as requiring monitoring and potential policy response:
- Scenario Alpha (Sahel Cascade): A confirmed El Niño monsoon deficit in the Sahel in June–August 2026 triggers a second consecutive poor harvest (2026/27) across the Liptako-Gourma region. JNIM and IS-Sahel expand territorial influence in the resulting governance vacuum. Jihadist spillover into “third-generation” coastal states (Benin, Togo, Ghana, Côte d’Ivoire) accelerates from current incipient levels to established presence. West African integration (ECOWAS) is permanently fractured. The window for multilateral stabilization closes.
- Scenario Beta (Horn Displacement Spiral): El Niño long-rain deficit in Ethiopia and Somalia in June–September 2026 drives a displacement surge of 2–3 million people from rural to peri-urban areas. Al-Shabaab uses the displacement for financial and recruitment gain. Federal Government of Somalia’s military campaign gains are reversed. The Ethiopian political situation deteriorates as domestic food stress increases pressure on an already-fragile post-Tigray governance compact. Cross-border displacement between Ethiopia, Somalia, and Kenya intensifies.
- Scenario Gamma (Sudan-Horn Food Security Collapse): El Niño overlaid on Sudan’s civil war produces a simultaneous collapse of rain-fed agriculture in Darfur, Kordofan, and Blue Nile states, generating IPC Phase 5 (Catastrophe) conditions in conflict-affected agricultural areas. International humanitarian access remains blocked. The conflict in Sudan metastasizes into neighboring states through refugee and armed actor spillover into Chad, South Sudan, and Ethiopia.
CHAPTER 7
7. Macroeconomic and Sectoral Impacts
7.1 Aggregate Economic Modeling: The State of the Literature
The quantification of El Niño’s macroeconomic consequences has advanced substantially in recent years, moving from descriptive ex-post damage assessments to prospective, model-based projections that attempt to quantify both the direct impacts and the persistence effects. This section reviews the three most analytically well-established contributions and their implications for the 2026 event.
The foundational peer-reviewed estimate is provided by Callahan and Mankin (2023, Science, “Persistent Effect of El Niño on Global Economic Growth”). Using a global climate-economy model calibrated against the historical ENSO record and validated against observed GDP responses in ENSO-sensitive economies, Callahan and Mankin find that the 1982–83 El Niño generated approximately $4.1 trillion in cumulative income losses globally; the 1997–98 event generated approximately $5.7 trillion; and they project approximately $84 trillion in 21st-century cumulative losses under intensifying ENSO in a high-emissions scenario.
The methodological distinction that makes the Callahan and Mankin work particularly valuable is their finding that the economic impacts are “persistent”, that is, the GDP losses associated with El Niño events do not reverse within two to three years as conventional disaster economics might predict, but continue to suppress growth trajectories for three to five years after the event’s meteorological conclusion. Lead author Christopher Callahan stated in a 2023 press release: “The persistent nature of these losses is the most important finding. Societies and economies absolutely do not just take a hit and recover.”
A companion study in Nature Communications (2023) produced contemporaneous point-in-time loss estimates using a slightly different modeling approach: $246 billion for 1982–83, $401 billion for 1997–98, and $739 billion for 2015–16 in contemporaneous losses, with cumulative four-year losses of $1.3 trillion, $2.1 trillion, and $3.9 trillion respectively. The discrepancy between the Callahan/Mankin cumulative figures and the Nature Communications contemporaneous figures reflects the different time horizons modeled (5 years vs. 4 years) and the treatment of persistence effects.
For the 2026 event, Citigroup Global Perspectives & Solutions (2026) produced a scenario-based economic assessment: base case (Strong El Niño): $3–5 trillion in cumulative losses over five years (approximately 2.7–3.2% of projected global GDP over the period); “super El Niño” scenario (Very Strong, peak ≥2.0°C): up to $7 trillion (approximately 6.4% of GDP). The Citigroup analysis explicitly incorporates climate change amplification factors, the warming background that produces more severe agricultural and infrastructure impacts per unit of ENSO anomaly, not present in the historical-event-based models.
At the national level, FAO and the Anticipation Hub (2024) found that in the most vulnerable El Niño-affected economies, the event reduced GDP by up to 1.7 percentage points and elevated public debt ratios, further constraining the fiscal space available for national disaster response. This fiscal feedback loop is the mechanism through which El Niño events compound over time: the countries most damaged are least able to invest in recovery and resilience, producing the persistence effects that Callahan and Mankin document.
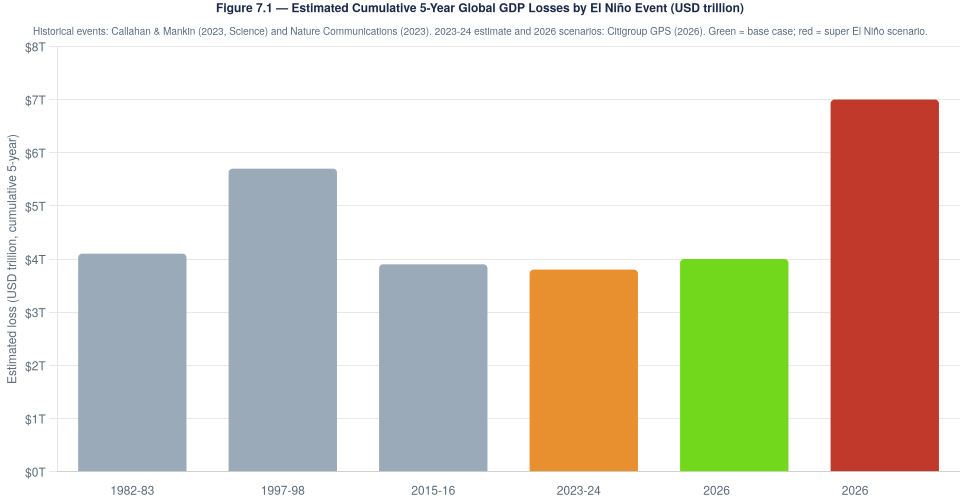
Figure 7.1: Estimated Cumulative 5-Year Global GDP Losses by El Niño Event (USD trillion). Historical events: Callahan & Mankin (2023, Science) and Nature Communications (2023). 2023–24 estimate: Citigroup GPS (2026) retroactive estimate. 2026 scenarios: Citigroup GPS (2026). Green = base case (Strong event); red = super El Niño scenario (Very Strong, peak ≥ +2.0°C). Sources: Callahan & Mankin 2023; Nature Communications 2023; Citigroup GPS 2026.
7.2 Country-Level GDP and Fiscal Exposure
| Country | GDP per capita PPP (2025, USD) | GDP growth 2025 (%) | Projected El Niño GDP impact (pp) | Debt/GDP ratio (2025) | Fiscal capacity to self-respond |
| Zimbabwe | $2,400 | +1.8% | –1.5 to –2.5 pp (Scenario C) | ~95% (IMF estimate) | VERY LIMITED: external arrears unresolved; USD-only economy; informal financing dominant; ARC insurance primary fiscal buffer |
| Zambia | $4,100 | +2.4% | –1.2 to –2.0 pp | ~145% (post-restructuring) | LIMITED: post-restructuring debt covenant restrictions; copper revenue highly correlated with hydropower capacity |
| Malawi | $1,500 | +2.1% | –1.0 to –1.7 pp | ~62% | LIMITED: FX crisis; parallel rate premium >100%; tobacco export revenue only buffer; IMF Extended Credit Facility constrains expenditure |
| Ethiopia | $2,800 | +6.0% | –0.8 to –1.4 pp | ~38% | MODERATE: relatively stronger fiscal position; large domestic food production base; humanitarian appeal capacity |
| Niger | $1,200 | +4.8% | –0.9 to –1.5 pp | ~55% (est.) | VERY LIMITED: post-coup suspension of EU/US budget support; gold/uranium export revenue blocked by sanctions |
| Pakistan | $6,200 | +3.5% | –0.5 to –1.2 pp | ~74% | LIMITED: IMF SBA program in force; 60%+ of revenue to debt service; limited fiscal headroom; food import dependent |
| Guatemala | $9,400 | +3.8% | –0.3 to –0.7 pp | ~27% | MODERATE: relatively low debt; remittance buffer (18% of GDP); anticipatory action plan pre-positioned |
Table 7.1: Country-level GDP and fiscal exposure to El Niño 2026. GDP per capita and debt ratios: IMF World Economic Outlook (April 2026). GDP impact projections: ISDO based on Callahan & Mankin (2023) country-level regression coefficients and Citigroup (2026) scenario parameters. Fiscal capacity assessment: ISDO analysis.
7.3 The Hydropower Cascade: Kariba as Case Study
The Southern African hydropower crisis of 2023–24 is the most concrete recent illustration of El Niño’s second-order economic consequences, the knock-on effects that flow from agricultural and hydrological impacts into energy systems, industrial production, and public services. The Kariba Dam case merits detailed treatment because it is both a likely repeat scenario in 2026/27 and a paradigmatic example of the infrastructure vulnerabilities that make El Niño events economically catastrophic in ways that agricultural loss data alone do not capture.
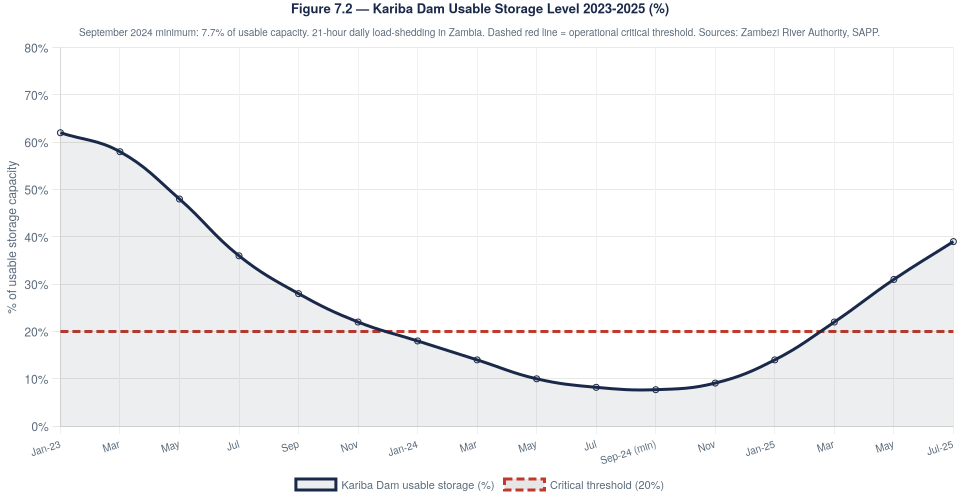
Figure 7.2: Kariba Dam Usable Storage Level 2023–2025 (% of usable capacity). The September 2024 minimum of 7.7% forced daily load-shedding of up to 21 hours in Zambia and near-complete shutdown of Zimbabwe’s Kariba power station (214 MW operational vs. 1,050 MW installed capacity). Dashed red line = operational critical threshold (20%). The dam has not returned to full operational capacity as of mid-2026, entering the 2026/27 El Niño season partially depleted. Sources: Zambezi River Authority; SAPP Monthly Generation Report; World Bank Infrastructure Note (2025).
The Kariba crisis produced a cascade of economic consequences that operated through multiple transmission channels simultaneously. The copper mining channel: Zambia’s Copperbelt produced approximately 800,000 metric tons of refined copper in 2023, generating approximately $6.4 billion in export revenue (approximately 75% of Zambia’s total goods exports). Extended power outages forced operational curtailment at major mines, reducing 2024 copper output by an estimated 15–20% and directly reducing foreign exchange earnings. The food system channel: electrical outages disrupted milling operations (maize must be milled before it can be consumed), cold-chain infrastructure for food distribution, and water pumping systems for urban water supply, compounding the agricultural production shortfall with a food distribution failure. The public service channel: hospitals dependent on electricity lost refrigeration for vaccines and blood products; operating theaters were unable to function; water treatment plants went offline in multiple cities.
The Zambezi River Authority (ZRA) monitors Kariba storage levels weekly. As of the most recent reading available for this report (late June 2026), Kariba storage remained sharply below its long-term average for this time of year, reflecting the partial but incomplete refilling of the reservoir during the 2024/25 and 2025/26 rainy seasons. If the 2026/27 austral summer rainy season confirms the below-normal rainfall expected under the El Niño forecast, Kariba storage could fall to critical levels (below 20% of usable capacity) by August–September 2027, repeating the 2024 crisis.
The medium-term solution to Southern Africa’s hydropower vulnerability is regional grid diversification and expanded investment in non-hydropower renewable energy. The Southern African Power Pool (SAPP) has documented approximately 2,500 MW of solar and wind projects in various stages of development across the SADC region; accelerating these projects, particularly battery-storage-enabled solar in Zambia and Zimbabwe, would seriously reduce the vulnerability of both countries to drought-driven hydropower shortfalls. ISDO recommends emergency fast-tracking of these projects as part of the El Niño response, as elaborated in Chapter 9.
7.4 Agricultural Commodity Export Revenue Losses
El Niño-driven agricultural production shortfalls translate directly into government revenue losses through the fiscal channels of reduced agricultural export earnings, lower value-added tax from reduced economic activity, and decreased personal income tax from agricultural-sector workers. For the most agriculturally dependent economies in the analysis, those where agriculture contributes more than 25% of GDP and more than 40% of export earnings, these fiscal effects can be severe.
Quantitative estimates for specific commodity export revenue losses are inherently scenario-dependent and are presented here as ranges rather than point estimates. Under Scenario B (Strong El Niño), ISDO estimates: Zimbabwe maize and tobacco export losses of $180–280 million (approximately 8–12% of projected 2026 agricultural export revenue); Zambia copper output losses (through hydropower disruption rather than direct El Niño agricultural impact) of $600–900 million; West African cocoa revenue losses (Côte d’Ivoire and Ghana combined) of $800 million–$1.4 billion; Indonesian palm oil production losses of $1.2–2.0 billion; and Australian wheat production losses of $900 million–$1.5 billion.
Under Scenario C (Very Strong), these estimates increase by approximately 50–80%, and additional knock-on losses from global commodity price impacts, trade finance disruption, and insurance claims would substantially increase the aggregate figure beyond the sum of individual national export losses.
7.5 Insurance, Reinsurance, and Sovereign Risk Finance
The insurance dimension of El Niño risk management deserves detailed treatment because the 2023–24 event produced the first operational proof-of-concept for parametric sovereign insurance at scale in the Southern African context, and because the 2026 event creates both an opportunity to extend this coverage and a test of the mechanism’s adequacy.
African Risk Capacity (ARC) is the African Union’s specialized climate risk pooling mechanism, established in 2012 and operational since 2014. ARC offers parametric (index-based) drought insurance to African governments, with payouts triggered by satellite-based vegetation and rainfall indices rather than assessed crop losses. The parametric structure allows payouts to be processed within weeks of trigger conditions being confirmed, compared to the approximately 18 months typically required to mobilize donor humanitarian financing.
ARC’s 2023–24 payouts demonstrated both the mechanism’s effectiveness and its current coverage limitations: Zimbabwe received $31.8 million (the largest single ARC payout in the mechanism’s history, supporting approximately 508,435 households across 27 districts); Zambia received $13.3 million; Malawi received $11.6 million; and Mozambique received $5.5 million. Total ARC payouts for 2023–24 were approximately $62 million, meaningful but far below the scale of the assessed humanitarian need (Zimbabwe alone appealed for $2 billion). The $62 million represents what was available to purchase in advance through ARC; the $2 billion represents what was needed in response. The gap between insured and needed is the primary metric of the coverage inadequacy that ISDO’s policy recommendations address.
Swiss Re Institute projects total global insured natural-catastrophe losses in 2026 at approximately $148 billion (in a base-case scenario) and up to $320 billion in modeled extreme scenarios. These figures, while not El Niño-specific, reflect the broader insurance market environment in which El Niño 2026 claims will be processed. The global natural-catastrophe protection gap, the difference between total economic losses and insured losses, stood at approximately $424 billion in 2025, with emerging economies 80–90% uninsured by comparison with advanced economies’ 50–60% insured shares.
CHAPTER 8
8. Humanitarian Response Architecture
8.1 The Financing Crisis: Structural Analysis
The 2026 El Niño arrives against the worst humanitarian financing backdrop in at least a decade. This is not simply a quantitative observation about the level of funding; it reflects structural changes in the political economy of humanitarian aid that are likely to persist and may worsen over the near- to medium-term, creating a permanent downward pressure on the humanitarian system’s capacity to respond to large-scale events like El Niño.
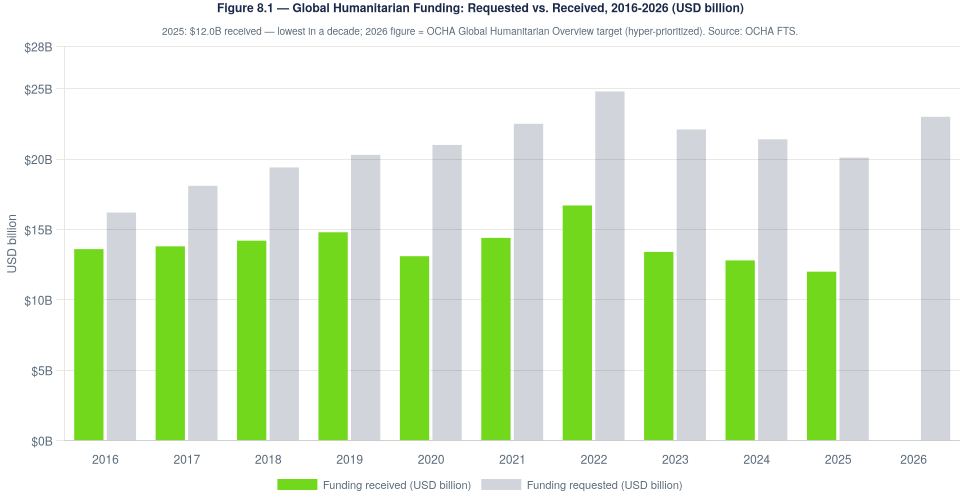
Figure 8.1: Global Humanitarian Funding: Requested vs. Received, 2016–2026 (USD billion). Green bars = funding received; light bars = funding requested per OCHA Global Humanitarian Overview. 2025: $12.0 billion received, the lowest in a decade; 2026 target = $23.0 billion (hyper-prioritized GHO). The structural gap between requests and received funding has been persistent since 2020 and widening since 2023. Source: OCHA Financial Tracking Service (FTS); ISDO compilation.
The structural drivers of the financing crisis are multiple and interacting. First, the diversion of donor resources toward European security financing following Russia’s 2022 invasion of Ukraine has permanently reallocated material portions of NATO member humanitarian budgets toward defense, border security, and Ukrainian reconstruction. This reallocation is not temporary: it reflects a reassessment of defense priorities that is unlikely to reverse regardless of the Ukraine conflict’s trajectory.
Second, domestic political constraints on aid budgets in key donor countries have intensified. The United States, historically the world’s largest humanitarian donor, providing approximately 40% of global humanitarian funding at peak, has experienced Congressional resistance to overseas aid appropriations that has reduced both the volume and predictability of US humanitarian financing. Similar dynamics are operating in Germany (constitutional debt brake constraints), the United Kingdom (development finance merger with foreign policy), and several Nordic countries.
Third, the multiplication of simultaneous humanitarian crises, Sudan, DRC, Yemen, Gaza, Haiti, Ukraine, and multiple Sahel emergencies simultaneously, has created “compassion fatigue” and donor prioritization pressures that force humanitarian agencies to make explicit tradeoffs between crises. In a year when the Sudan conflict generates massive political attention and funding demands, El Niño response competes for the same limited donor budget envelope.
The quantitative consequence of this structural financing crisis for the 2026 El Niño response is stark. The 2026 Global Humanitarian Overview (GHO), which OCHA explicitly described as “hyper-prioritized” to match available funding rather than reflecting assessed need, targets $23 billion for 87 million people. The actual need was assessed at approximately 305 million people requiring humanitarian assistance globally, implying that the GHO covers only approximately 29% of those in documented need. Against this baseline, funding the $202 million FAO/WFP El Niño anticipatory action appeal, 0.9% of the GHO target, should be among the most achievable near-term financing goals. The evidence base for its effectiveness is stronger than for virtually any other humanitarian investment of comparable scale.
8.2 The FAO/WFP Joint Anticipatory Action Appeal: Architecture and Evidence
The first-ever Joint Anticipatory Action Appeal by FAO and WFP, launched on June 18, 2026 and seeking $202 million to protect 8.8 million people across 22 high-risk countries, represents the most consequential institutional evolution in El Niño humanitarian preparedness since the development of the ENSO forecasting system itself. This section analyzes its design, evidence base, and current funding status.
The appeal is built on the anticipatory action model, which treats pre-event risk reduction as a fundamentally different and higher-value activity than post-event emergency response. Anticipatory action, delivering assistance before a climate shock materializes, based on meteorological triggers, allows: agricultural protection activities (drought-tolerant seed distribution, livestock destocking support before prices collapse, cash transfers before harvest failure) that are impossible or prohibitively expensive after the event; market stabilization through pre-event food purchases that avoid the price spike that emergency procurement generates; and protection of productive assets (livestock, equipment, seed stocks) that, once lost, require multiple years to rebuild.
The evidence base for anticipatory action’s effectiveness has grown substantially in recent years. Key studies include:
- Bailey and Harvey (2017, World Development): Using a randomized controlled trial design in Ethiopia, found that households receiving anticipatory drought assistance one to two months before a drought event had better food security outcomes, less asset loss, and less child malnutrition than matched control households receiving equivalent assistance three months after the event.
- WFP Anticipatory Action Operations Review (2025): Found that anticipatory action programs reached between 3.3 and 6.2 million people per year in 2023 and 2024 respectively, with cost-effectiveness ratios of approximately $5–7 in avoided humanitarian response costs per $1 of anticipatory investment in the programs evaluated.
- FAO Anticipatory Action Tracker (2026): Documents 93 anticipatory action interventions completed or in progress globally in 2025, with a combined reach of approximately 4.8 million people and an average cost-effectiveness ratio (based on avoided losses in livestock, crops, and productive assets) of approximately $6.20 per $1 invested.
- Horn of Africa analysis (Anticipation Hub, 2024): Found $2.3–3.3 in net benefit per $1 of anticipatory action investment in drought-prevention programming across Ethiopia, Somalia, and Kenya, with the highest returns from livestock destocking support provided 6–8 weeks before drought-induced mortality began.
8.3 Early Warning Systems: Architecture and Performance
The information infrastructure available for El Niño impact monitoring and anticipatory action trigger management is the most sophisticated in the history of humanitarian response. This section describes the key systems and their performance characteristics:
8.3.1 FEWS NET
The Famine Early Warning Systems Network, funded by USAID and operated through a consortium including USGS, NASA, NOAA, and multiple academic institutions, provides monthly IPC-equivalent acute food insecurity projections at sub-national scale for 35+ countries. FEWS NET country reports are produced 6–12 times per year, providing both a current situation assessment (most likely outcomes over the next four months) and a projected situation (most likely outcomes over the following four months). The FEWS NET temporal projection horizon (8 months) is broadly compatible with El Niño’s lead time for agricultural impact, making it the primary operational tool for anticipatory action trigger management in the Sahel, Horn, and Southern Africa.
FEWS NET’s analytical model incorporates: satellite-based precipitation monitoring (CHIRPS, FLDAS); vegetation condition indices (NDVI anomalies); market price monitoring (WFP’s Food Price Monitoring and Analysis tool); livelihood zone mapping; and field validation through partner network organizations. Its track record in anticipating food security deteriorations has been assessed as broadly accurate, with a tendency toward conservative projections (understating rather than overstating deteriorations) that may undercount the risk in rapidly developing crisis situations.
8.3.2 The IPC Process
The Integrated Food Security Phase Classification (IPC) provides the globally accepted standard for food security emergency classification, from IPC Phase 1 (Minimal) through Phase 5 (Catastrophe/Famine). IPC analyses are produced through a multi-agency consensus process involving national governments, UN agencies, NGOs, and academic institutions, and are formally endorsed by the IPC Global Support Unit. The IPC process is both an analytical tool and a political process: its findings are used to mobilize donor financing, trigger humanitarian response systems, and in some cases activate domestic emergency procurement and reserve releases.
The IPC’s temporal limitation is relevant to the El Niño context: analyses project 6–8 months ahead, meaning that the El Niño impact on the 2026/27 Southern African harvest (October 2026 onward) will not be visible in IPC projections published before approximately October 2026. This creates a gap between the meteorological evidence (which already warrants anticipatory action) and the food security classification evidence (which will lag by 4–6 months). The resolution of this gap is precisely the role of the FAO/WFP Joint Anticipatory Action Appeal, which uses meteorological forecasts rather than food security classifications as its primary trigger.
8.3.3 ICPAC/GHACOF and GEOGLAM
The IGAD Climate Prediction and Applications Centre (ICPAC) produces the Greater Horn of Africa Climate Outlook Forum (GHACOF) seasonal climate outlook four times per year, providing probabilistic precipitation and temperature forecasts that directly inform anticipatory action triggers for the Horn of Africa. The May 2026 GHACOF was the primary source for the June–September 2026 rainfall probability estimates used in Chapter 3.3 of this report.
The GEOGLAM Crop Monitor, produced under the G20 Agricultural Market Information System (AMIS) by a consortium of national agricultural monitoring agencies, provides monthly assessments of crop condition (rated from “favorable” to “failure” across eight production stages) for major growing regions globally. The Crop Monitor’s near-real-time satellite-based assessments provide an early signal of production shortfalls before yield surveys or harvest data become available, typically with a 4–6 week lead time relative to formal government crop assessments.
8.4 Coverage Gaps and the Binding Constraint
The fundamental constraint on anticipatory El Niño response in 2026 is neither information quality nor operational capacity, both are at historically high levels. It is financing, specifically the availability of financing:
- Before trigger thresholds close: Anticipatory action for the June–August 2026 West African Monsoon period requires disbursement by early July at the latest for planting-related activities; for the October 2026 Southern African season, by August–September.
- At sufficient scale: The $202 million FAO/WFP appeal covers 8.8 million people, approximately 4% of the 52.8 million in IPC Phase 3+ in the Sahel alone. Full funding of the appeal would be a serious but far-from-sufficient response.
- In the right form: Anticipatory action requires predictable, fast-disbursing financing, not the traditional humanitarian pledging conference model, which typically produces funding 6–18 months after the initial request. Forecast-based financing mechanisms (CERF, regional humanitarian funds, anticipatory financing windows at the World Bank IDA and the African Development Bank) are the appropriate instruments.
ISDO estimates, based on the regional analyses in Chapter 3 and the scaling parameters of existing anticipatory action programs, that full anticipatory coverage of the most vulnerable populations in the 22 FAO/WFP priority countries would require approximately $800 million–$1.2 billion, four to six times the current appeal. This is, by any standard, a modest sum relative to both the avoided humanitarian costs (estimated at $5.6–8.4 billion at the $7 per $1 return ratio) and the macroeconomic losses documented in Chapter 7. The case for investment is overwhelming; the constraint is political will.
CHAPTER 9
9. Policy Recommendations
This chapter presents ISDO’s policy recommendations organized across three time horizons. The recommendations are grounded in the analytical findings of Chapters 3–8 and prioritized by the combination of expected impact, time-sensitivity, and political feasibility. They are addressed to a composite audience: national governments of affected and donor countries, multilateral institutions (UN agencies, the World Bank, IMF, and regional development banks), the European Union and G7, humanitarian practitioners, and the private sector (particularly the insurance industry and agricultural commodity market participants).
A critical framing point bears repeating: this report has documented that the three primary response domains, food security and humanitarian response, conflict prevention, and migration management, are mutually interdependent. A response that addresses only one domain while neglecting the others will be systematically less effective. The policy recommendations below reflect this interdependence explicitly.
| ESCALATION THRESHOLDS: WHEN TO INTENSIFY ALL RECOMMENDED ACTIONSThe following meteorological and food security signals should serve as trigger points for immediate escalation of all recommended actions to their maximum intensity:→ Meteorological: Niño 3.4 SST anomaly ≥ +2.0°C on the 3-month running mean (Very Strong event confirmed)→ West Africa: West African Monsoon onset confirmed >2 weeks late by ICPAC (July 2026 seasonal assessment)→ Food markets: FAO All Rice Price Index rising >15% quarter-on-quarter→ Southern Africa: October–December 2026 seasonal forecast confirmed below-normal from SAWS/ICPAC→ Sahel: IPC Phase 4 (Emergency) population rising above 2.5 million in Cadre Harmonisé update→ Governance: Any third-generation coastal West African state (Benin, Ghana, Togo, Côte d’Ivoire) experiencing an armed jihadist attack claiming IS or JNIM affiliationActivation of any TWO of these thresholds simultaneously should trigger an emergency convening of the G7 Development and Foreign Ministers and UN Emergency Relief Coordinator within 10 working days. |
9.1 Immediate Actions (June–September 2026)
The June–September 2026 period is the most time-sensitive window for anticipatory action. Agricultural planting calendars, livestock destocking timelines, and social protection mechanisms all have lead-time requirements that make action in this window qualitatively different from (and more valuable than) equivalent action in October or beyond. The recommendations in this section require policy decisions and financing commitments within weeks, not months.
Recommendation 1: Fully Fund the $202 Million FAO/WFP Joint Anticipatory Action Appeal
Priority: Critical. Lead actors: G7 governments, EU, Gulf Cooperation Council member states, bilateral donors.
The single highest-return intervention available in the June–September 2026 window is full funding of the FAO/WFP Joint Anticipatory Action Appeal. With documented returns of up to $7 per $1 invested (FAO Deputy Director-General Beth Bechdol, June 2026), and with trigger-based financing windows for the critical agricultural planting, livestock protection, and social protection activities closing within months, delay is directly costed in human lives and asset losses.
Benchmark: Achieve full funding by end-August 2026. If 60% is not reached by that date, G7 donors should collectively authorize emergency reallocation from contingency humanitarian reserves (CERF, individual donor contingency funds) to cover the shortfall. The $202 million requested represents approximately 0.9% of the 2026 Global Humanitarian Overview target, a share so modest that its non-funding would represent a profound institutional failure of donor prioritization rather than a resource constraint.
The 22 priority countries, covering 8.8 million people, represent only the most acute first-tier caseload. ISDO recommends that donors simultaneously authorize an additional contingency envelope of $150–200 million, to be released in two tranches (September 2026 and January 2027) based on event intensity, for expansion of coverage to a wider second-tier population.
Recommendation 2: Pre-Position Sovereign Parametric Risk Insurance
Priority: Critical. Lead actors: African Development Bank (AfDB), World Bank, ARC Agency, G7 bilateral donors.
The ARC payout mechanism for Zimbabwe ($31.8 million, 2024) demonstrated that parametric index insurance can deliver sovereign fiscal support in weeks rather than months. ISDO recommends that G7 governments and the World Bank co-finance the extension of ARC coverage to all major SADC countries not yet covered, with policies in force before the October 2026 southern hemisphere spring planting season. Priority countries: Malawi, Mozambique, Namibia, Madagascar (in addition to existing Zimbabwe, Zambia coverage renewal).
Analogous parametric mechanisms should be developed or extended for key Sahel states, recognizing that the combination of high political risk (military governments, Western sanctions on Niger), low premium-paying capacity, and the need for donor subsidy of premiums makes standard ARC enrollment difficult. The World Bank’s Climate Risk Financing initiative and the African Development Bank’s Disaster Risk Finance program offer potential vehicles.
Benchmark: All high-risk SADC states with material hydropower or rain-fed agriculture dependence should have confirmed ARC or equivalent parametric coverage in force before October 1, 2026.
Recommendation 3: Activate Forecast-Based Financing Pipelines in the Sahel and Horn
Priority: High. Lead actors: CERF, Regional Humanitarian Funds (OCHA), FAO, WFP, ICPAC/GHACOF.
Central America’s June 2026 CERF disbursement ($4 million, triggered when forecasts confirmed a rainfall shortfall) demonstrates the operational viability of forecast-based financing at scale. This model should be immediately replicated in the Horn of Africa, where ICPAC/GHACOF provides the equivalent seasonal climate forecasting infrastructure, and in the Sahel, where FEWS NET provides the early warning foundation.
Operationalizing a trigger-based disbursement mechanism in the Sahel before the peak of the 2026 El Niño requires: definition of specific meteorological and food security triggers (in collaboration with FEWS NET and ICPAC); pre-commitment of specific financing at predefined trigger levels; and pre-negotiation of operational plans with FAO, WFP, and national government partners. The technical foundations exist; the missing element is a pre-committed financing decision.
Recommendation 4: Issue a G20 Early Warning Alert on Food Price Risks
Priority: High. Lead actors: G20 Presidency (South Africa holds in 2026), AMIS/FAO, G7 Agriculture Ministers.
AMIS should convene an extraordinary session of G20 Agriculture Ministers in July–August 2026, specifically to: (a) review the El Niño forecast and its commodity market implications; (b) secure informal but public standstill commitments from major agricultural exporters against new export restrictions pending seasonal outcome data; and (c) activate AMIS’s enhanced monitoring protocol for rice, wheat, maize, and sugar, with monthly public reporting on supply and pricing indicators through March 2027.
This recommendation does not require legal commitments or formal treaty amendment. Its power is normative: a public, coordinated statement from G20 Agricultural Ministers that they are monitoring markets and commit to not imposing unilateral export restrictions would meaningfully reduce the risk of a contagion episode similar to 2023.
9.2 Medium-Term Actions (Through the 2026/27 Agricultural Season)
Recommendation 5: Guard Against Trade Policy Contagion
Priority: High. Lead actors: WTO, G7 Trade Ministers, AMIS, EU Trade Commissioner.
The 2023–24 India rice export ban demonstrated how unilateral trade policy responses to domestic supply concerns amplify global price spikes to degrees that dwarf the original production shortfall. ISDO recommends an emergency agricultural trade ministers’ meeting before November 2026, when the Northern Hemisphere is entering the peak of the El Niño impact season, to secure a collective standstill commitment against new export restrictions on staple food commodities.
The legal instrument for formalizing such a commitment remains under debate (WTO Agricultural Safeguards, Article XI exceptions, etc.). ISDO recommends pragmatism over perfect legality: a coordinated political declaration by G7 + Australia + India + major ASEAN exporters, even without legal enforceability, would substantially reduce the probability of the contagion episode that the 2023 India ban exemplified. The political achievement of getting India to make such a declaration, which requires diplomatic investment now, is the highest-value single diplomatic action available.
Benchmark: A coordinated declaration from G20 major agricultural exporters, adopted before December 1, 2026, committing to extraordinary transparency and bilateral consultation before implementing any export restrictions during the 2026/27 El Niño event cycle.
Recommendation 6: Emergency Diversification of Southern African Power Grids
Priority: High. Lead actors: AfDB, World Bank, SAPP, bilateral energy finance institutions.
The Zambia-Zimbabwe 21-hour load-shedding precedent should not be allowed to repeat. ISDO recommends fast-track financing for emergency solar-plus-battery installations at critical public facilities (hospitals, water pumping stations, cold storage for agricultural produce) in Zambia, Zimbabwe, and Malawi, with disbursement timelines targeting commissioning before the austral summer of 2026/27.
Specifically: (a) The AfDB should activate its $500 million Emergency Energy Transition Facility for Southern Africa, approved in principle in May 2026, with fast-track procurement procedures that compress the standard 18–24 month procurement timeline to 6–9 months; (b) SAPP’s grid interconnection projects, particularly the Zambia-Tanzania and Mozambique-Zimbabwe transmission capacity additions, should receive accelerated processing from national regulatory bodies; (c) Zambia’s government should immediately activate the Kafue Gorge Lower Hydropower Station (750 MW), which requires lower minimum lake levels than Kariba and can provide partial buffer.
Recommendation 7: Ring-Fence Conflict-Sensitive Humanitarian Assistance in the Sahel
Priority: High. Lead actors: WFP, FAO, UNICEF, UNHCR, EU ECHO, USAID.
In contexts where JNIM and IS-Sahel exploit food and water scarcity for territorial control and recruitment, the design of humanitarian assistance is itself a security policy tool. ISDO recommends that food and water assistance in the Sahel be designed and delivered in ways that deny armed groups the opportunity to control, tax, or claim credit for its provision.
Operationally: (a) Prioritize direct-to-beneficiary cash and voucher assistance (CVA) over in-kind food distribution where market functionality allows, CVA bypasses physical distribution points that armed groups can control, tax, or disrupt; (b) Support community-led water governance structures that reduce dependence on centralized infrastructure that JNIM targets for destruction; (c) Where in-kind distribution is required, use multiple small distribution points rather than central hubs, reducing the signature that armed groups can interdict; (d) Condition humanitarian presence negotiations on population protection guarantees where armed groups are the de facto authority.
9.3 Structural Resilience Investments (2026-2030)
Recommendation 8: Scale Drought-Tolerant Crop Systems and Water Harvesting
Priority: Medium-High. Lead actors: CGIAR, national agricultural research systems, AfDB, bilateral donors.
The fundamental vulnerability of Sahelian and Southern African food systems is their dependence on single-season rain-fed agriculture in zones where El Niño-driven rainfall variability is climatologically predictable and recurring. A portfolio of investments that collectively reduce this dependence represents the most cost-effective long-term El Niño resilience strategy. ISDO recommends priority investment in:
- Drought-tolerant, short-cycle crop variety deployment: CGIAR-developed drought-tolerant maize (DTMA varieties, developed in collaboration with IITA and CIMMYT) and short-cycle millet and sorghum varieties adapted to Sahel conditions are available but require agricultural extension investment to reach smallholder farmers at scale. Target: 30% of Sahel cereal area planted with climate-adapted varieties by 2030.
- Water harvesting and smallholder irrigation: Half-moon (demi-lune) water harvesting, zai pits, and sand dams have demonstrated 40–100% yield improvements in comparable settings (SWAC/OECD, 2020; WOCAT database). These investments require initial technical assistance and subsidy but are maintained by communities after establishment. Target: 5 million additional hectares under improved water management by 2030 in Sahel and Southern Africa.
- Livestock water point development: Boreholes, solar-powered pumps, and earthen dams for livestock water access in pastoral zones reduce the distance animals travel for water during dry periods, reducing weight loss and mortality. These are particularly important in areas where JNIM has destroyed existing water infrastructure, reconstruction of destroyed infrastructure combined with diversification to reduce single-point vulnerability.
Recommendation 9: Institutionalize Anticipatory Action Financing
Priority: Medium-High. Lead actors: OCHA, World Bank IDA, bilateral donors, national finance ministries.
The current operational model, in which anticipatory action financing must be secured through emergency appeals to donors each time an El Niño forms, is chronically inefficient, time-consuming, and produces funding too late to be fully effective. ISDO recommends three complementary institutional reforms:
1. National El Niño contingency budget lines: Finance ministers in high-risk ENSO countries (Zimbabwe, Zambia, Malawi, Ethiopia, Somalia, Guatemala, Honduras) should establish dedicated contingency budget lines, pre-approved by parliament, for El Niño response that can be released within 30 days of a declared El Niño onset, without requiring a supplementary budget appropriation.
2. World Bank IDA Crisis Response Window pre-commitment: The World Bank’s Crisis Response Window (CRW) within IDA provides fast-disbursing grants and credits for disaster response. ISDO recommends that the World Bank Board pre-authorize a CRW allocation for El Niño response, potentially activated automatically when IRI assigns >80% probability of a Strong El Niño, eliminating the Board authorization delay that currently adds 3–6 months to response timelines.
3. Multi-year anticipatory action trust funds: Donors should transition from ad-hoc contributions to El Niño appeals toward multi-year voluntary contributions to dedicated anticipatory action trust funds at FAO and WFP, providing advance financing that is pre-deployed rather than raised in response to specific events. The El Niño is predictable; the financing should be pre-positioned accordingly.
Recommendation 10: Invest in the Southern African Power Pool Interconnection
Priority: Medium. Lead actors: AfDB, World Bank, bilateral energy finance institutions (Proparco, DEG, BII).
The Kariba crisis demonstrated that Zambia and Zimbabwe’s exclusive dependence on a single shared reservoir for the majority of their electricity generation is a systemic vulnerability. The solution, regional grid interconnection that allows electricity to flow from surplus-generating areas to deficit areas during drought, is a long-documented need that has advanced slowly due to financing constraints and cross-border regulatory complexity.
ISDO recommends that the 2026 El Niño crisis serve as the political catalyst for accelerated investment in: (a) the Zambia-Tanzania interconnector (approx. $800 million, under development), which would allow Zambia to import Tanzanian surplus hydropower (generated from less drought-sensitive northern catchments) during Southern African dry seasons; (b) solar PV expansion in Zimbabwe and Zambia to provide base-load generation that is not hydropower-dependent; and (c) regional coordination mechanisms under SAPP that allow automatic load-sharing when any single national system falls below 70% generation capacity.
CHAPTER 10
10. Conclusions
The El Niño now forming in the tropical Pacific is not a future threat. It is a present and accelerating reality, confirmed by the full range of operational meteorological centers, expressing itself in current SST anomalies and subsurface heat content levels that make a strong-to-very-strong event highly probable for the September–December 2026 peak period. Its humanitarian, economic, and security consequences will unfold across multiple regions simultaneously, with cascading interactions between agricultural shocks, commodity price transmission, displacement dynamics, and conflict escalation that no single agency or government has the mandate (or the capacity) to manage in isolation.
This assessment has documented three structural patterns that define the nature of the 2026 El Niño challenge, and that must inform the design of any adequate response.
10.1 Three Structural Patterns
Pattern One: The Compounding Crisis Strikes a System in Motion
The 2026 El Niño does not arrive at a neutral or recovering system. The populations most exposed to its impacts, in the Sahel, Southern Africa, the Horn of Africa, and Central America, are already at or near the limits of their adaptive capacity after years of overlapping climate shocks, conflict, economic disruption, and institutional erosion. The 2023–24 El Niño was the worst Southern African drought in a century; the Sahel is recording its highest-ever food insecurity figures before the 2026 event has even peaked; Somalia has sustained four severe drought episodes in five years; and the Kariba Dam has not fully recharged before the next drought season begins.
This pattern has a critical policy implication: the marginal humanitarian cost of the 2026 event, the additional suffering attributable to El Niño above the counterfactual baseline, is superimposed on populations whose capacity to absorb additional shock is already exhausted. The analogy is a patient who has not recovered from the previous illness before being exposed to the next pathogen. The appropriate response is not to wait until the clinical presentation has deteriorated; it is to intervene preventively before the additional insult is applied. This is the operational logic of anticipatory action, and it has never been more clearly applicable than it is in July 2026.
Pattern Two: The Information Infrastructure Is Ready; the Financing Is Not
Perhaps the most important (and most frustrating) finding of this report is that the gap between what is known and what is done has never been wider, while the gap between what the evidence supports and what the financing provides has never been wider. The early warning architecture available for El Niño monitoring, FEWS NET, GIEWS, IPC, ICPAC/GHACOF, GEOGLAM, the ENSO monitoring centers, provides converging signals of exceptional clarity and advance notice. The operational mechanisms for translating that knowledge into humanitarian protection, anticipatory action frameworks, parametric insurance, forecast-based financing, are proven and functioning. The cost-effectiveness ratios are among the highest available in the development finance toolkit. And yet the funding pipeline is slower, less certain, and more politically constrained than at any point in the past decade.
This is an institutional failure, not a knowledge failure or an operational failure. It represents a misallocation of international attention and resources that will cost far more, in human suffering, in economic losses, in security deterioration, and in the costs of reactive emergency response, than the anticipatory investment that would have prevented it. ISDO’s primary institutional recommendation from this report is for the donors and multilateral institutions that comprise the global humanitarian system to acknowledge this structural mismatch explicitly and begin the reforms, national contingency budgets, World Bank CRW pre-commitments, multi-year anticipatory trust funds, that would correct it.
Pattern Three: Food Security, Migration, and Security Are One Interconnected System
The analytical architecture of the international response system still, in 2026, treats food security, migration, and security as separate mandates managed by separate agencies with separate budgets and separate accountability structures. The FAO manages food security. IOM and UNHCR manage displacement. UNDP and national governments manage conflict prevention. These distinctions have administrative logic, but they are analytically and operationally wrong for the El Niño context.
This report has documented, in chapter-level detail, that: El Niño-driven food insecurity is a primary driver of migration decisions; migration pressure intensifies political tensions in receiving states; political tensions produce border management policies that divert migration flows to more dangerous routes, increasing mortality; mortality and displacement disrupt remittance flows to source communities; remittance disruption worsens food security in source communities; food insecurity in source communities expands the recruitment pool for jihadist organizations; jihadist expansion destroys agricultural infrastructure; and destroyed agricultural infrastructure worsens food insecurity. This is a closed loop, and an intervention at any single point that does not also address the adjacent nodes will be partially or wholly absorbed by the system without breaking the cycle.
The ISDO Multi-Domain Risk Assessment framework, applied throughout this report, is one analytical response to this integration challenge. The organizational response, which requires institutional architecture changes that are beyond the scope of any single report, is the longer-term imperative that the El Niño 2026 event once again brings into sharp relief.
10.2 The Window of Opportunity
ISDO concludes this assessment with a statement about timing that is simple, verifiable, and important. The policy window for effective anticipatory action in the 2026 El Niño cycle, the period in which intervention costs are lowest and effectiveness is highest, is open now, in July 2026, and will narrow substantially by September 2026 and close largely by December 2026. After December, the event will have already delivered much of its humanitarian, economic, and security impact.
The decisions made, and the resources mobilized or withheld, in the next eight weeks will define the humanitarian outcomes of 2026–2027 for tens of millions of people in the most vulnerable regions on Earth. The analytical case for action is established by this report and by the broader body of evidence it draws on. The operational mechanisms for action are proven and available. The cost-effectiveness case for action is stronger than for virtually any alternative use of comparable resources. What remains is the political decision to act before the crisis is visible, rather than after it is unavoidable.
This report is ISDO’s contribution to the information environment in which that decision will be made. The International Sustainable Development Observatory calls on the governments, multilateral institutions, and humanitarian actors with the capacity to act to do so, in the June–September 2026 window, with the urgency and scale that the evidence warrants.
ANNEX A
Annex A: Key Data Tables
A.1 El Niño Intensity Classification and Historical Reference
| Intensity Class | ONI Threshold (3-month avg) | Recent Events | Peak Season | Typical Economic Loss Range |
| Weak | +0.5°C to +0.9°C | 2004-05, 2006-07, 2018-19 | NH winter | $0.2–0.8T cumulative (limited regional impacts) |
| Moderate | +1.0°C to +1.4°C | 2002-03, 2009-10, 2014-15 | NH winter | $0.8–2.0T cumulative |
| Strong | +1.5°C to +1.9°C | 1986-87, 2023-24 | NH winter | $2.0–4.0T cumulative |
| Very Strong | ≥ +2.0°C | 1982-83, 1997-98, 2015-16 | NH winter (Nov–Jan) | $3.9–5.7T cumulative (Callahan & Mankin, 2023) |
| 2026 (forming, July 2026) | +1.7°C mid-Jun (rising); 63% chance ≥2.0°C (NOAA) | Forming, peak: Sep–Dec 2026 | Nov–Jan 2026–27 | $3–7T (Citigroup GPS 2026, base–super scenarios) |
Table A.1: ENSO intensity classification and historical economic reference. Economic loss ranges: Callahan & Mankin (2023, Science); Citigroup GPS (2026). Note: Economic loss estimates are cumulative 5-year figures in 2026 USD equivalents.
A.2 Global Acute Food Insecurity Hotspots, IPC Phase 3+, June 2026
| Country/Region | People IPC Phase 3+ (millions) | Peak IPC Phase | Primary Driver (2026) | El Niño Exposure | In FAO/WFP Appeal |
| Nigeria (priority states) | 25.0+ | Phase 4 (NE) | Conflict; poverty; inflation | High | Yes |
| Sahel (15 countries, lean season) | 52.8 (projection) | Phase 4 (localized) | Conflict; drought; structural poverty | Very High | Yes (Cameroon, Nigeria included) |
| Sudan | 33.7 in need | Phase 5 (Cat.) localized | Civil war; displacement | Moderate-High | Yes |
| Ethiopia | 20.0+ | Phase 4 | Drought; conflict; displacement | High | Yes |
| Somalia | 7.1 | Phase 4 | Drought; conflict | Very High | Yes |
| Yemen | 17.0 | Phase 4 | Conflict; economic collapse | Moderate | Partial |
| Afghanistan | 14.0 | Phase 4 | Governance; economic collapse | Moderate | Yes |
| Zimbabwe | 5.0+ (projected Oct 2026) | Phase 3-4 (Oct 2026) | El Niño drought; fiscal crisis | Critical (Oct 2026) | Yes |
| Haiti | 5.83 | Phase 4 (1.8M) | Gang violence; economic collapse | Compounding | No |
| Guatemala (Dry Corridor) | 3.0+ | Phase 3 | Drought; poverty; El Niño | High (current) | Yes |
| Pakistan (exposed districts) | 8.0+ | Phase 3 | Drought; economic fragility; post-2022 floods | High | Yes |
Table A.2: Global acute food insecurity hotspots as of June 2026. IPC Phase 3+ populations from most current IPC/CH analyses. El Niño exposure reflects 2026/27 forecast intensity. “In FAO/WFP Appeal” = explicitly included in the June 18, 2026 Joint Anticipatory Action Appeal. Sources: IPC Global Network; Cadre Harmonisé; FAO GIEWS; FEWS NET; FAO/WFP Joint Appeal (June 2026).
A.3 ARC 2023–24 Drought Payouts by Country
| Country | ARC Payout (USD) | Households Supported | Districts Covered | Payout Timeline | Notes |
| Zimbabwe | $31.8 million | 508,435 | 27 districts | Within 5 weeks of trigger | Largest single ARC payout in mechanism history; used for cash transfers and food assistance |
| Zambia | $13.3 million | Est. 175,000 | Multiple provinces | Within 6 weeks of trigger | Southern and Eastern Provinces most affected; cash transfers primary modality |
| Malawi | $11.6 million | Est. 150,000 | Southern Region | Within 5 weeks of trigger | Combined with WFP programming; tobacco farming regions hardest hit |
| Mozambique | $5.5 million | Est. 70,000 | Southern Mozambique | Within 7 weeks of trigger | Smaller payout reflecting lower policy coverage relative to need |
| TOTAL 2023–24 | $62.2 million | ~903,000+ | Multiple | Average: ~5.5 weeks | First ARC crisis season to exceed $60M in payouts; validated the parametric mechanism at scale |
Table A.3: African Risk Capacity (ARC) sovereign parametric drought insurance payouts for the 2023–24 El Niño event season. Comparison: Zimbabwe alone appealed for $2 billion in international assistance, highlighting the gap between parametric coverage and assessed need. Source: African Risk Capacity Agency (2024 Annual Report; press releases).
ANNEX B
Annex B: Selected Bibliography
B.1 Peer-Reviewed Literature
Barnston, A.G., Glantz, M.H., and He, Y. (1999). Predictive Skill of Statistical and Dynamical Climate Models in SST Forecasts during the 1997–98 El Niño Episode and the 1998 La Niña Onset. Bulletin of the American Meteorological Society, 80(2), 217–243. https://doi.org/10.1175/1520-0477(1999)080%3C0217:PSOSAN%3E2.0.CO;2
Burke, M.B., Solomon, M.H., and Miguel, E. (2015). Climate and Conflict. Annual Review of Economics, 7(1), 577–617. https://doi.org/10.1146/annurev-economics-060213-013503
Callahan, C.W., and Mankin, J.S. (2023). Persistent Effect of El Niño on Global Economic Growth. Science, 380(6649), 1064–1069. https://doi.org/10.1126/science.adf2983
Hsiang, S.M., Meng, K.C., and Cane, M.A. (2011). Civil Conflicts Are Associated with the Global Climate. Nature, 476(7361), 438–441. https://doi.org/10.1038/nature10311
Janicot, S., Trzaska, S., and Poccard, I. (2001). Summer Sahel-ENSO Teleconnection and Decadal Time Scale SST Variations. Climate Dynamics, 18(3–4), 303–320. https://doi.org/10.1007/s003820100168
Klomp, J., and Bulte, E. (2013). Climate Change, Weather Shocks, and Violent Conflict. Journal of Conflict Resolution, 57(3), 527–546. https://doi.org/10.1177/0022002712459709
Krishnamurthy, V., and Goswami, B.N. (2000). Indian Monsoon–ENSO Relationship on Interdecadal Timescale. Journal of Climate, 13(3), 579–595. https://doi.org/10.1175/1520-0442(2000)013%3C0579:IMEIRO%3E2.0.CO;2
Kumar, K.K., Rajagopalan, B., and Cane, M.A. (1999). On the Weakening Relationship between the Indian Monsoon and ENSO. Science, 284(5423), 2156–2159. https://doi.org/10.1126/science.284.5423.2156
Landis, S.T. (2014). Temperature Seasonality and Violent Conflict: The Inconsistencies of a Warming Planet. Journal of Peace Research, 51(5), 603–618. https://doi.org/10.1177/0022343314534437
Lindesay, J.A. (1988). South African Rainfall, the Southern Oscillation and a Southern Hemisphere Semi-Annual Cycle. International Journal of Climatology, 8(1), 17–30. https://doi.org/10.1002/joc.3370080103
Nath, S. et al. (2023). Economic Consequences of Major El Niño Events. Nature Communications, 14, 8305. https://doi.org/10.1038/s41467-023-43962-8
Reason, C.J.C., Landman, W., and Tennant, W. (2006). Seasonal to Decadal Prediction of Southern African Climate and Its Links with Variability of the Atlantic Ocean. Bulletin of the American Meteorological Society, 87(7), 941–955. https://doi.org/10.1175/BAMS-87-7-941
Verschuur, J., Li, S., Wolski, P., and Otto, F.E.L. (2021). Climate Change as a Driver of Food Insecurity in the 2015 El Niño Event in Southern Africa and East Africa. Nature Climate Change, 11(10), 861–866. https://doi.org/10.1038/s41558-021-01105-7
von Uexkull, N., Croicu, M., Fjelde, H., and Buhaug, H. (2016). Civil Conflict Sensitivity to Growing-Season Drought. Proceedings of the National Academy of Sciences, 113(44), 12391–12396. https://doi.org/10.1073/pnas.1607542113
Walker, G.T. (1924). Correlations in Seasonal Variations of Weather. IX. Memoirs of the India Meteorological Department, 24, 275–332.[Historical document; digitized copy via India Meteorological Department Archive, imd.gov.in]
B.2 Institutional and Governmental Publications
African Risk Capacity (ARC) Agency. (2024). ARC 2023–24 Season Drought Payout Summary. Johannesburg: ARC. https://www.arc.int/news/arc-zimbabwe-payout
Callahan, C. (2023, May 18). Press Release: New Research Finds El Niño Events Cause Trillions in Economic Losses. Dartmouth College News. https://home.dartmouth.edu/news/2023/05/el-nino-weather-events-cause-trillions-economic-losses
Citigroup Global Perspectives & Solutions. (2026). El Niño 2026: Economic Scenarios and Market Implications. New York: Citigroup.[Proprietary report; available to Citigroup institutional clients via citi.com/GPS]
FAO. (2026a, June 22). El Niño Is Coming. Here Is Where the Risks to Agriculture Are Highest. Rome: FAO Newsroom. https://www.fao.org/newsroom/detail/el-ni%C3%B1o-is-coming.-here-is-where-the-risks-to-agriculture-are-highest/en
FAO. (2026b, June). Food Outlook: Biannual Report on Global Food Markets. Rome: FAO. https://www.fao.org/publications/home/fao-flagship-publications/food-outlook/en
FAO. (2026c, June). FAO Food Price Index. Monthly release. Rome: FAO. https://www.fao.org/worldfoodsituation/foodpricesindex/en/
FAO and WFP. (2026, June 18). Bracing for El Niño: FAO and WFP Launch Joint Appeal to Protect 8.8 Million People from Extreme Weather Events. Rome: FAO/WFP Joint Press Release. https://www.fao.org/newsroom/detail/bracing-for-el-ni%C3%B1o–fao-and-wfp-launch-joint-appeal-to-protect-8.8-million-people-from-extreme-weather-events/en
FEWS NET. (2026, June). Multiple Country Acute Food Insecurity Situation and Projection Reports. Washington, D.C.: FEWS NET/USAID. https://fews.net/fews-data/333
Fund for Peace. (2025). Fragile States Index 2025. Washington, D.C.: Fund for Peace. https://fragilestatesindex.org/
ICPAC/GHACOF. (2026, May). Greater Horn of Africa Climate Outlook Forum 52nd Session Report. Nairobi: ICPAC. https://www.icpac.net/ghacof/
IOM. (2026, Q1). Displacement Tracking Matrix: Somalia Drought Displacement Tracking. Geneva: IOM DTM. https://dtm.iom.int/somalia
IPC Global Network. (2026). Integrated Food Security Phase Classification: Multiple Country Analyses. Rome: IPC Global Support Unit. https://www.ipcinfo.org/ipc-country-analysis/en/
IRI. (2026, June). ENSO Forecast Probability Table. New York: International Research Institute for Climate and Society, Columbia University. https://iri.columbia.edu/our-expertise/climate/forecasts/enso/current/
NOAA/CPC. (2026, June). Monthly ENSO Diagnostic Discussion and El Niño Advisory. Camp Springs, MD: NOAA Climate Prediction Center. https://www.cpc.ncep.noaa.gov/products/analysis_monitoring/enso_advisory/
OCHA. (2026). Global Humanitarian Overview 2026. Geneva: United Nations OCHA. https://www.unocha.org/global-humanitarian-overview
South African Weather Service (SAWS). (2026, June). ENSO Outlook and Seasonal Climate Forecast for Southern Africa. Pretoria: SAWS. https://www.weathersa.co.za/home/historicaldata
Tony Blair Institute for Global Change. (2024). Sahel Security Assessment 2024: Armed Group Exploitation of Climate Vulnerability. London: Tony Blair Institute. https://www.institute.global/insights/geopolitics-and-security/sahel
UNHCR. (2025). Global Trends in Forced Displacement 2025. Geneva: UNHCR. https://www.unhcr.org/global-trends-report
WMO. (2026, May). El Niño/La Niña Update, May 2026. Geneva: World Meteorological Organization. https://wmo.int/resources/publication-series/el-ninola-nina-updates/
World Bank. (2026, June). Commodity Markets Outlook: El Niño and Commodity Prices. Washington, D.C.: World Bank Group. https://www.worldbank.org/en/research/commodity-markets
ANNEX C
Annex C: Glossary of Technical Terms
AMIS: Agricultural Market Information System. A G20 initiative providing near-real-time global supply and demand data for major agricultural commodities, coordinated by FAO.
Anticipatory action: Humanitarian intervention delivered before a disaster materializes, based on meteorological triggers and early warning signals, as opposed to reactive response after impacts occur.
ARC (African Risk Capacity): The African Union’s specialized climate risk pooling mechanism, established in 2012, providing parametric (index-based) sovereign drought insurance to African governments.
Cadre Harmonisé (CH): The regional food security assessment framework covering 15 West African countries, producing harmonized IPC-equivalent classifications through a multi-agency process coordinated by CILSS (Permanent Inter-State Committee for Drought Control in the Sahel).
ENSO (El Niño-Southern Oscillation): The coupled ocean-atmosphere climate variability system centered on the tropical Pacific, which oscillates between El Niño (warm phase) and La Niña (cold phase) on 2–7-year cycles.
FEWS NET: Famine Early Warning Systems Network. USAID-funded network providing monthly food insecurity projections for 35+ countries, using satellite data, market monitoring, and field assessments.
GHACOF: Greater Horn of Africa Climate Outlook Forum. A seasonal climate outlook process for the Greater Horn of Africa, convened four times per year by ICPAC, providing probabilistic precipitation forecasts.
IPC (Integrated Food Security Phase Classification): The internationally accepted standard for classifying food security emergencies on a five-level scale from IPC Phase 1 (Minimal) to IPC Phase 5 (Catastrophe/Famine).
JNIM (Jamaa Nusrat ul-Islam wa al-Muslimin): Al-Qaeda’s primary Sahel affiliate, formed in March 2017. Active in Mali, Burkina Faso, and Niger. Controls approximately 40,000 km² of territory as of mid-2026.
Niño 3.4 region: The primary El Niño monitoring zone in the tropical Pacific, defined as the area between 5°N and 5°S latitude and 170°W and 120°W longitude.
Oceanic Niño Index (ONI): NOAA’s standard operational measure of El Niño intensity, calculated as the three-month running average of sea surface temperature anomalies in the Niño 3.4 region relative to the 1991–2020 climatological baseline.
Parametric insurance: Insurance where payouts are triggered by a pre-defined index (e.g., satellite rainfall measurement, vegetation index) rather than assessed losses, enabling rapid disbursement within weeks of trigger conditions being met.
Relative Niño index: An ECMWF-developed index introduced in June 2026 that adjusts the standard ONI for background warming trends, enabling more accurate comparisons between current El Niño events and historical analogues measured against a cooler baseline.
SAPP (Southern African Power Pool): The regional electricity trading platform and interconnection system for the SADC region, coordinating cross-border electricity generation and transmission among 12 member states.
Spring Predictability Barrier: The reduction in ENSO forecast skill that occurs when forecasts are made during the boreal spring (March–May), when the coupled ocean-atmosphere system is in a relatively unconstrained state. Forecasts made after June carry substantially higher confidence.
TAO/TRITON: The Tropical Atmosphere Ocean (TAO) and TRITON mooring array, a network of approximately 70 moored buoys in the equatorial Pacific between 8°N and 8°S, providing real-time ocean and atmospheric measurements that are the foundation of El Niño monitoring.
Teleconnection: A statistically material correlation between climate variables at widely separated geographic locations, mediated by large-scale atmospheric circulation patterns. El Niño teleconnections link tropical Pacific SST anomalies to regional rainfall and temperature patterns globally.
Walker Circulation: The overturning east-west atmospheric circulation system in the tropical Pacific, driven by the SST contrast between the warm western Pacific and cooler eastern Pacific. El Niño weakens the Walker Circulation by warming the eastern Pacific, fundamentally altering global atmospheric circulation patterns.